改造Java程序
在应用中引入监控所需要的jar包,包含prometheus和actuator
1 | <dependency> |
引入这2个包以后就通过prometheus抓取到应用的监控信息
修改应用配置,暴露监控端口
1 | management: |
- management.server.port:启用独立的端口来提供监控,未配置的情况下共用应用端口;
- management.metrics.tags.xxx:在统计信息中添加自定义的标签;
- management.endpoints.web.exposure.include:用于包含我们要公开的端点列表 , 我们这里设置为* 代表所有。
- management.endpoints.web.base-path:用于设置promethues的监控路径,默认是通过/actuator/prometheus访问,这样配置以后只需要通过/prometheus访问
配置完成后重启服务,通过浏览器访问localhost:8080/prometheus即可抓取到prometheus的监控数据,
创建ServiceMonitor
安装KubeSphere平台时已经安装好了promethus-operator, ServiceMonitor是prometheus-operator后创建的一种自定义资源,prometheus可以通过ServiceMonitor 自动识别带有某些 label 的service ,并从这些service 获取数据。
现在需要让promethus可以抓取到我们暴露的应用监控,所以需要创建一个如下的ServiceMonitor。
1 | apiVersion: monitoring.coreos.com/v1 |
详细说明一下各字段的意义:
- metadata下的name和namespace将指定ServiceMonitor所需的一些关键元信息。
- spec的endpoints为服务端点,代表Prometheus所需的采集Metrics的地址。endpoints为一个数组,同时可以创建多个endpoints。每个endpoints包含三个字段,每个字段的含义如下:
- interval:指定Prometheus对当前endpoints采集的周期。单位为秒,在本次示例中设定为30s。
- path:指定Prometheus的采集路径。设置为/prometheus,这个跟应用中暴露的监听端口保持一致。
- port:指定采集数据需要通过的端口,设置为/metrics设置的端口为 步骤三 创建Service时端口所设置的name。
- spec的namespaceSelector为需要发现的Service的范围。namespaceSelector包含两个互斥字段,字段的含义如下:
- any:有且仅有一个值true,当该字段被设置时,将监听所有符合Selector过滤条件的Service的变动。
- matchNames:数组值,指定需要监听的namespace的范围。例如,只想监听default和cloud-demo两个命名空间中的Service,那么matchNames设置如下:
1 | namespaceSelector: |
spec的selector用于选择Service。在本次示例所使用的Service有 micrometer-prometheus-discovery: ‘true’ Label,所以selector设置如下:
1 | selector: |
可以通过 kubectl apply -f micrometer-demo.yml 将其部署到集群中。
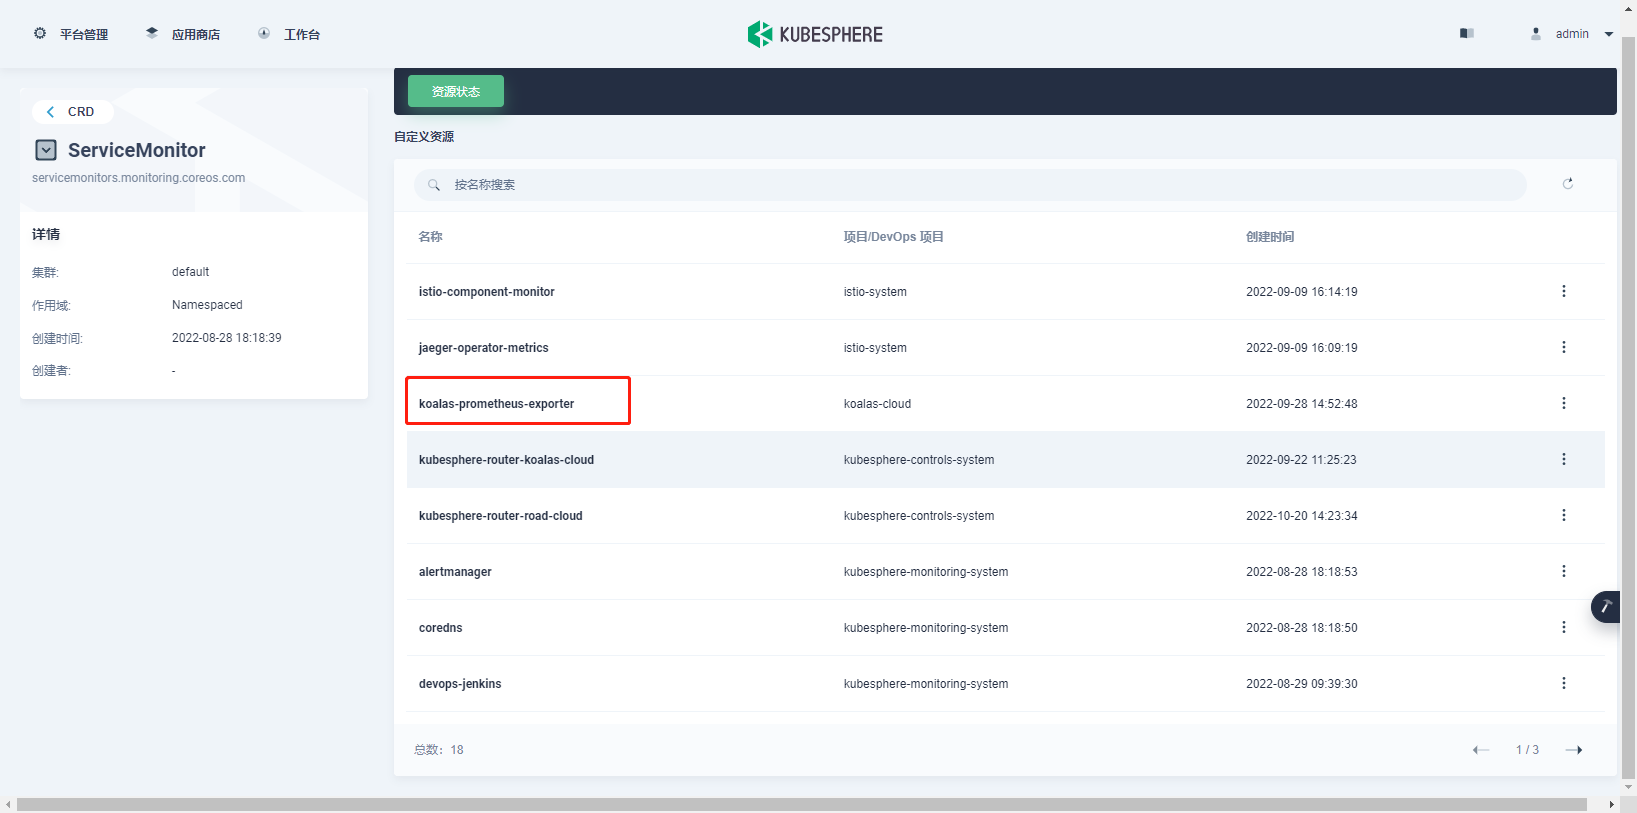
执行成功后可以在集群的 CRD 下面搜索 ServiceMonitor 并打开可以找到我们部署的 ServiceMonitor 配置。如图所示:
创建自定义监控
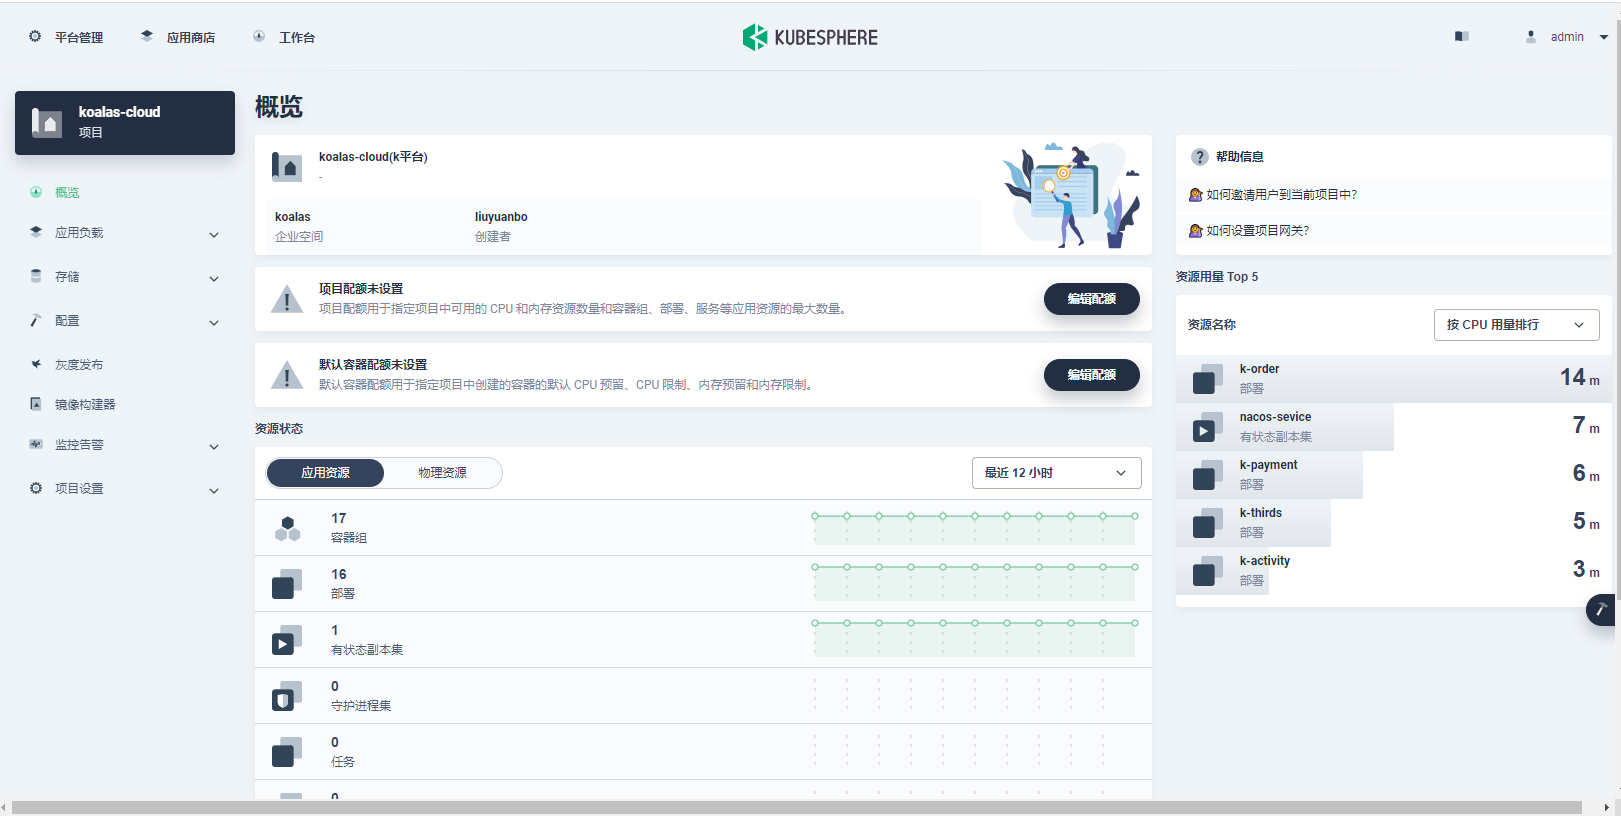
访问 集群-> 监控告警-> 自定义监控进入,如图所示:

我们点击创建 可以看到 KubeSphere 已经集成了部分监控面板,这里我们选择 Grafana。
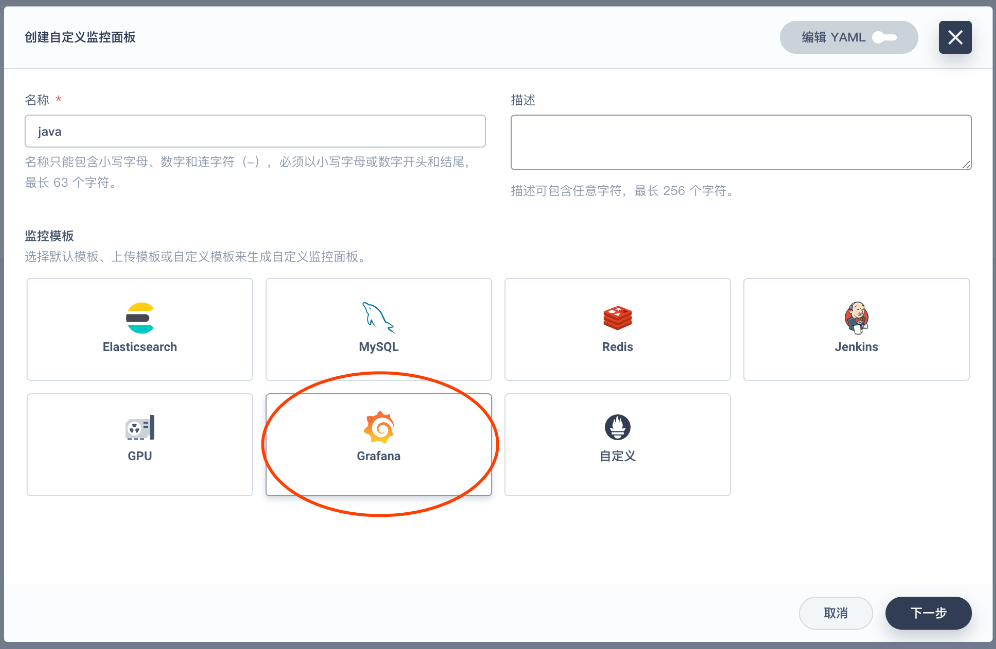
在下一步后系统会让我们上传 JSON 模版,我们可以通过 Grafana 官网下载一些通用的模版配置,这里我们使用的是 Spring Boot 2.1 Statistics。在右侧可以下载 JSON 文件。
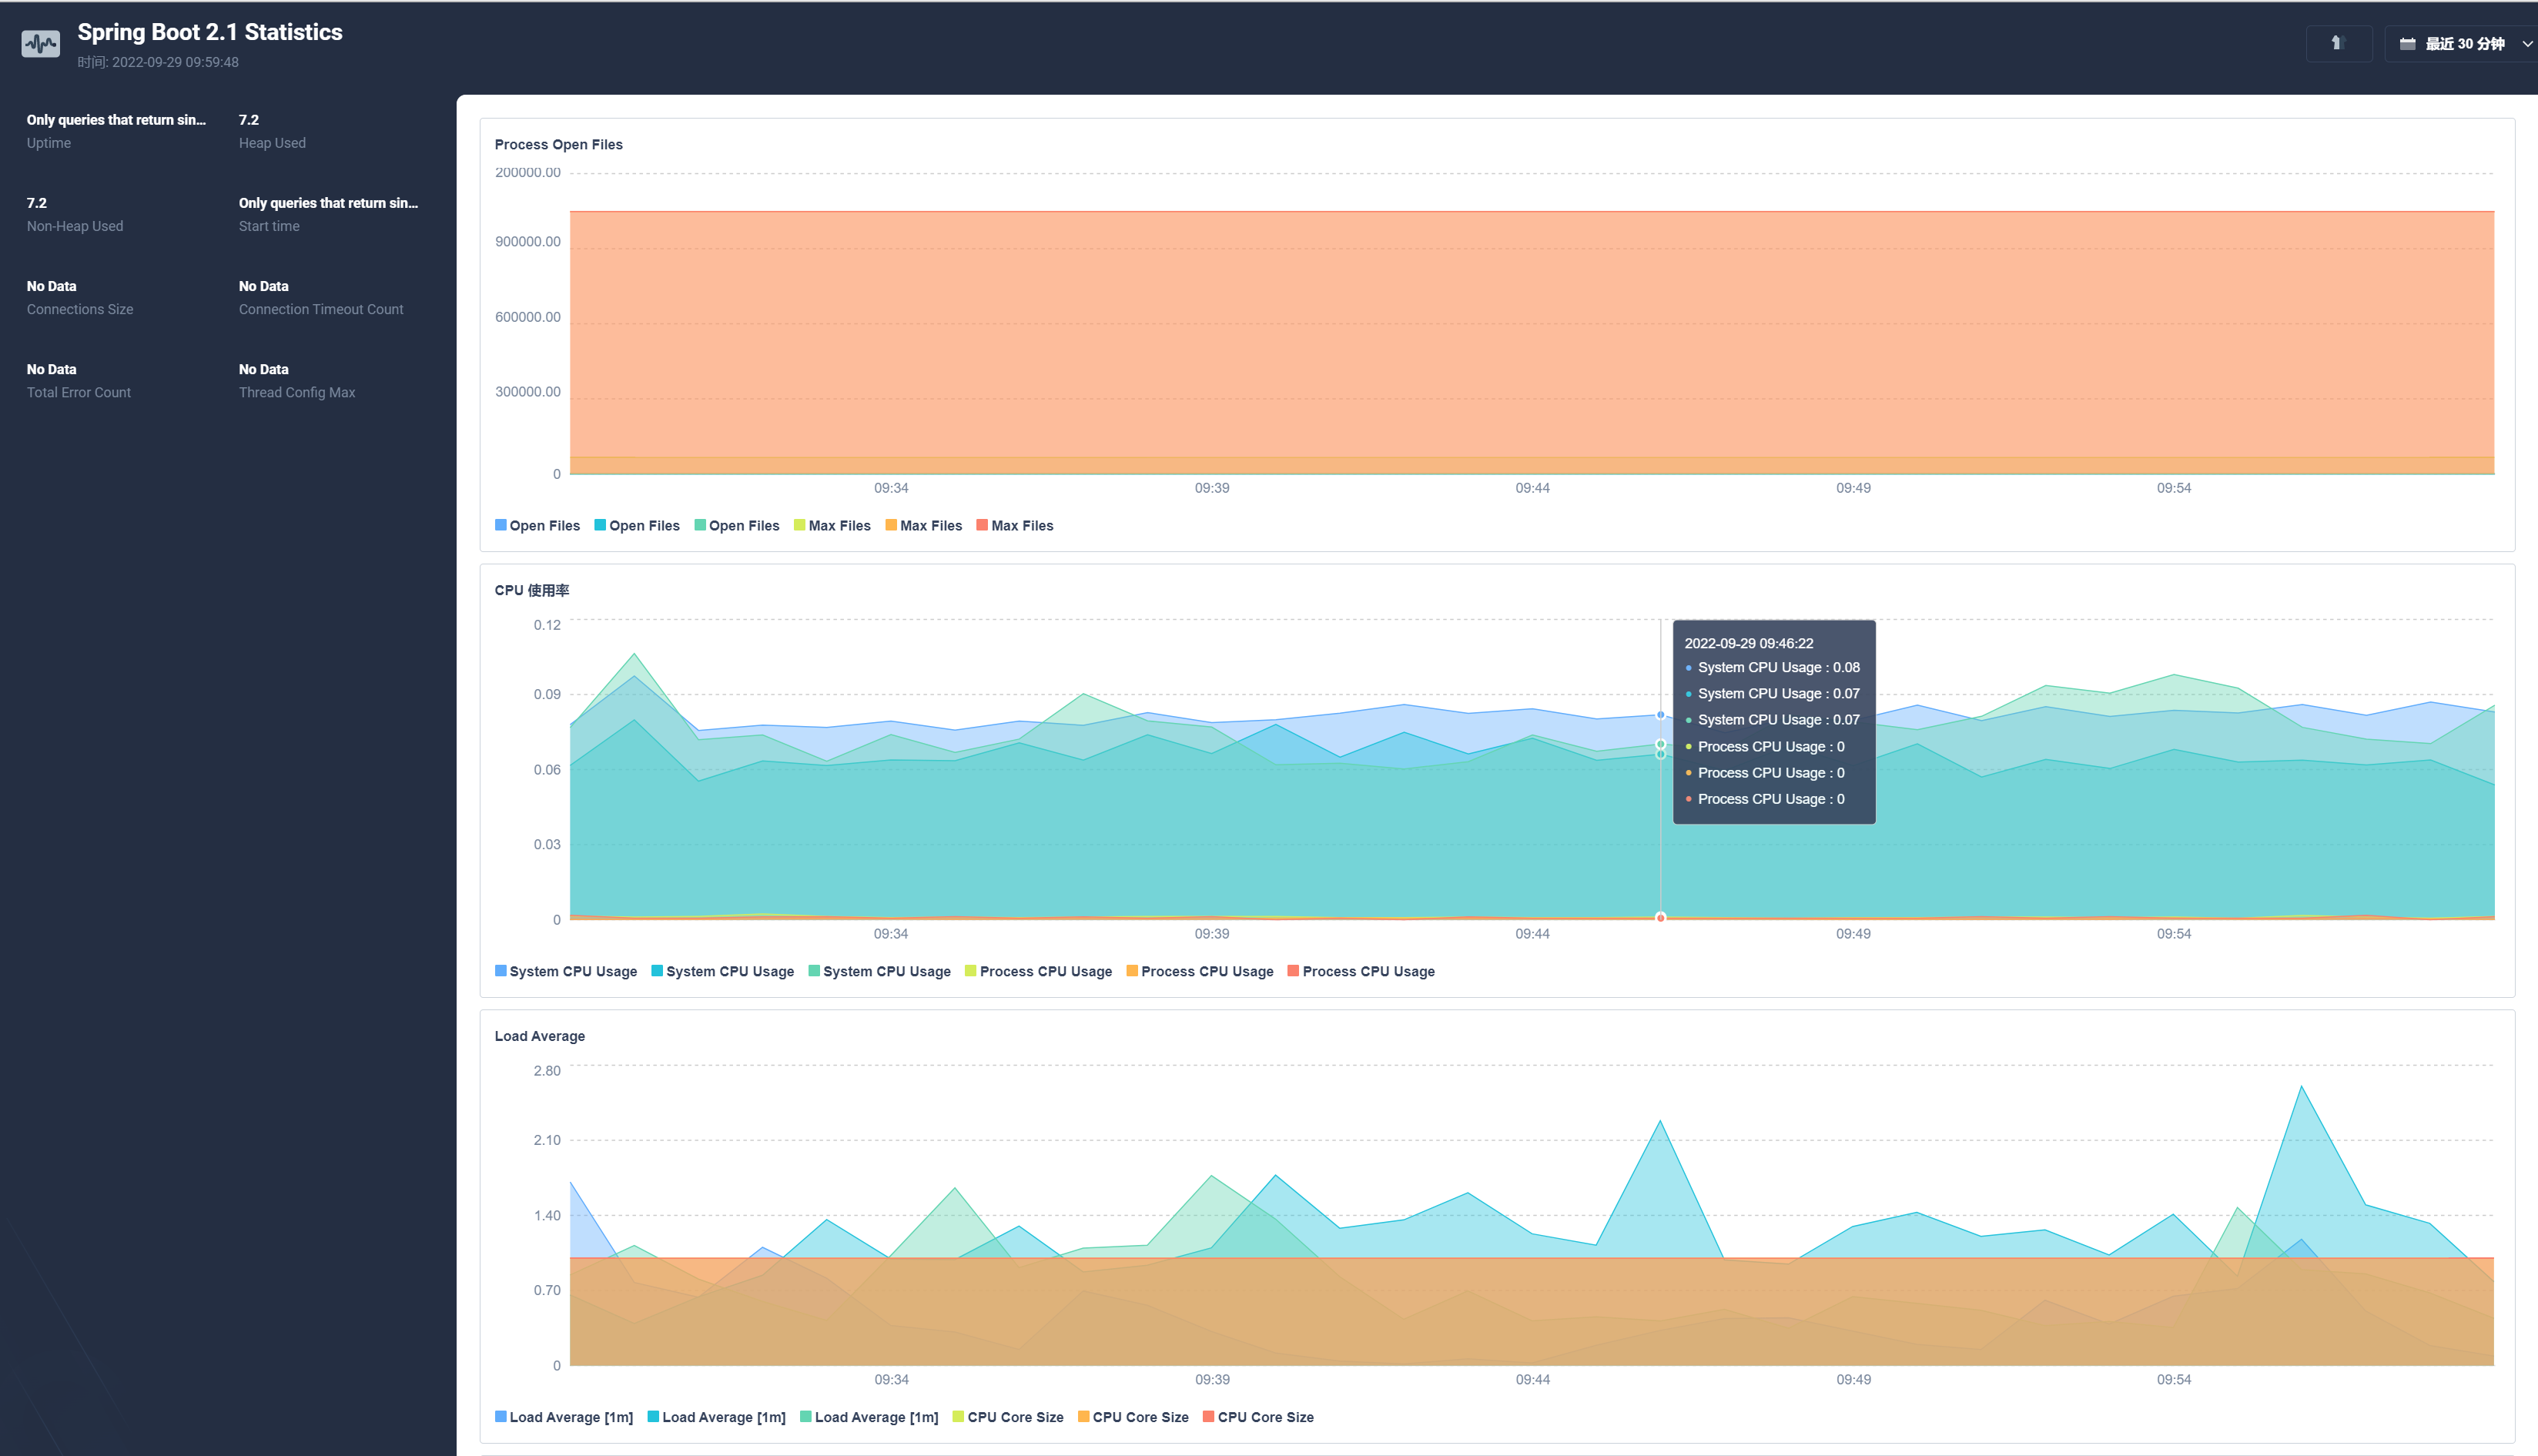
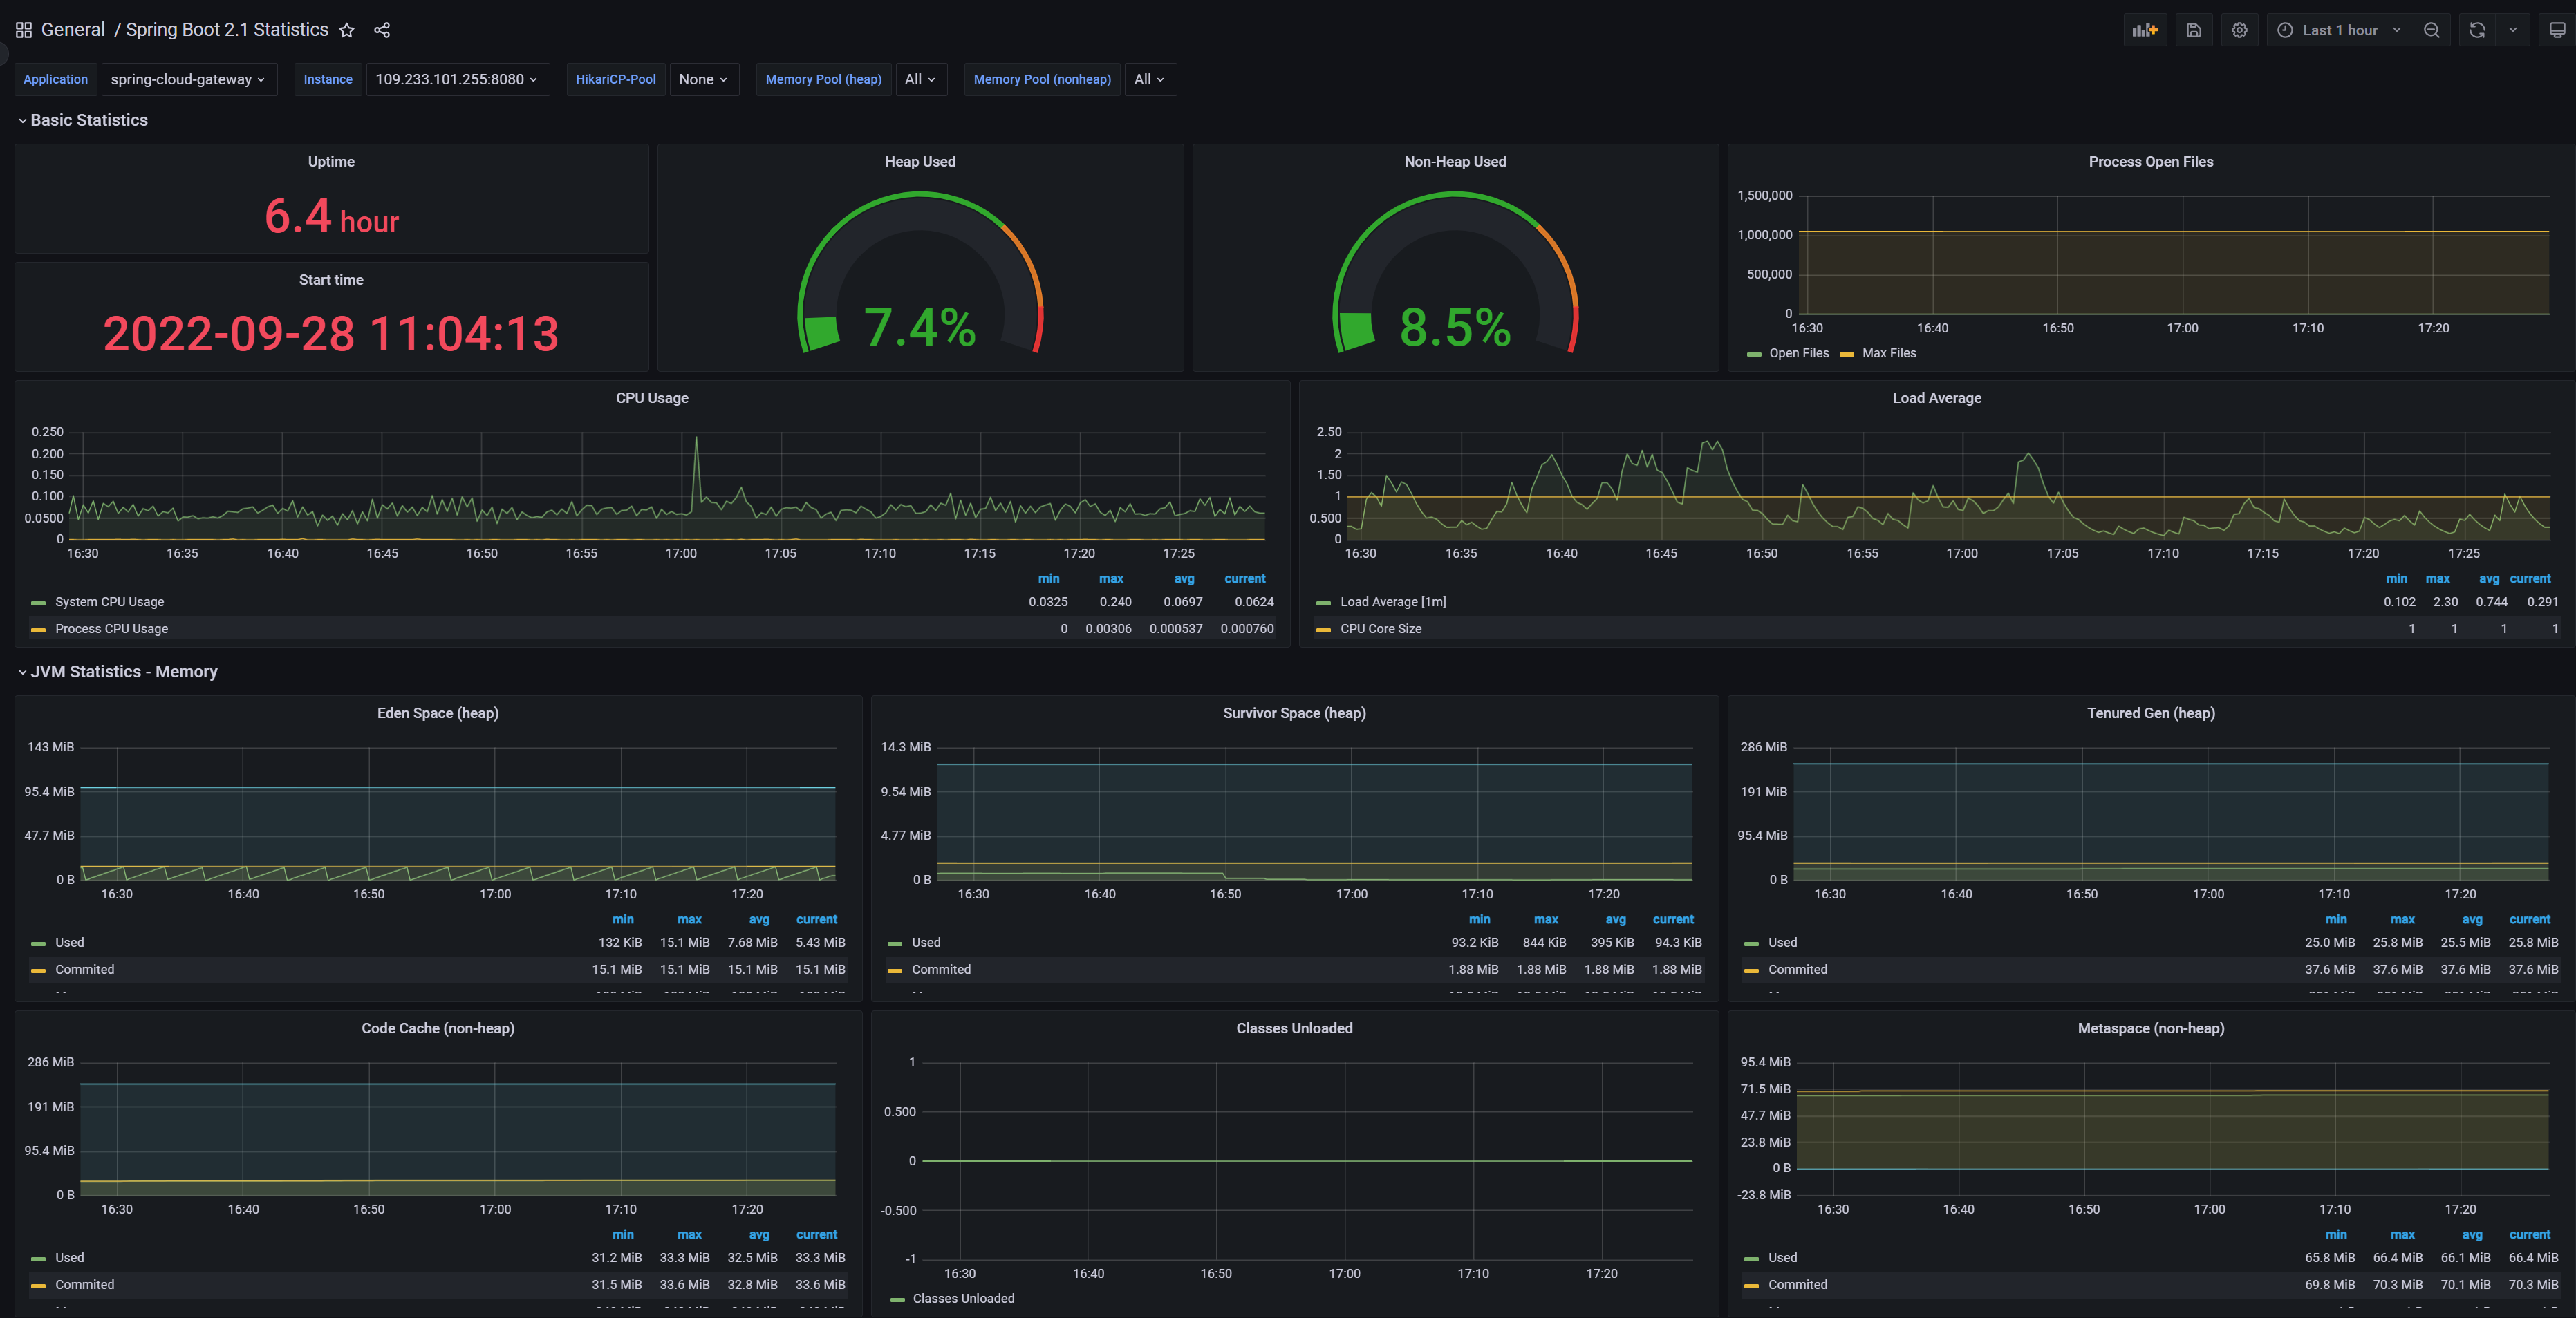
导入JSON后我们就可以看到相关监控指标了。
使用这种方式有个最大问题就是多个应用无法切换,像我们之前部署了3个应用在一张图中显示就很乱,所以需要通过外部Grafana展示监控数据。
安装独立的grafana
为了方便,我们直接使用KubeSphere提供的应用商店功能安装外部Grafana。
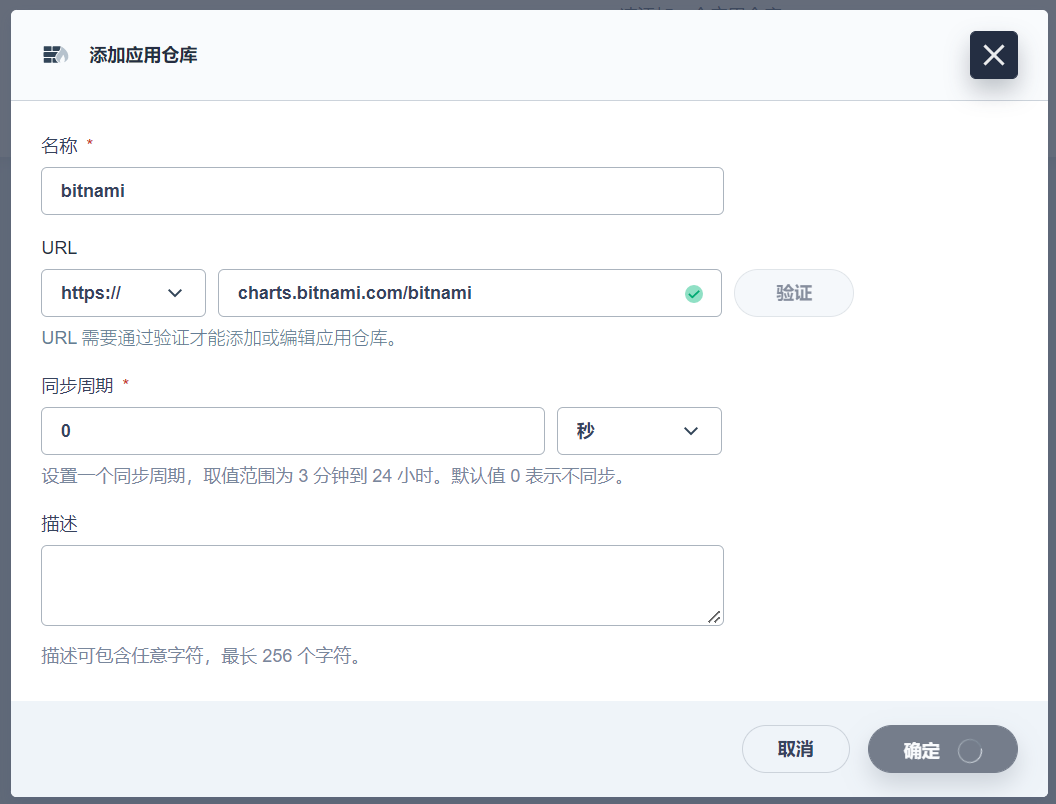
1、添加应用仓库
进入企业空间 -> 应用管理 -> 应用仓库,点击添加,加入bitnami应用仓库
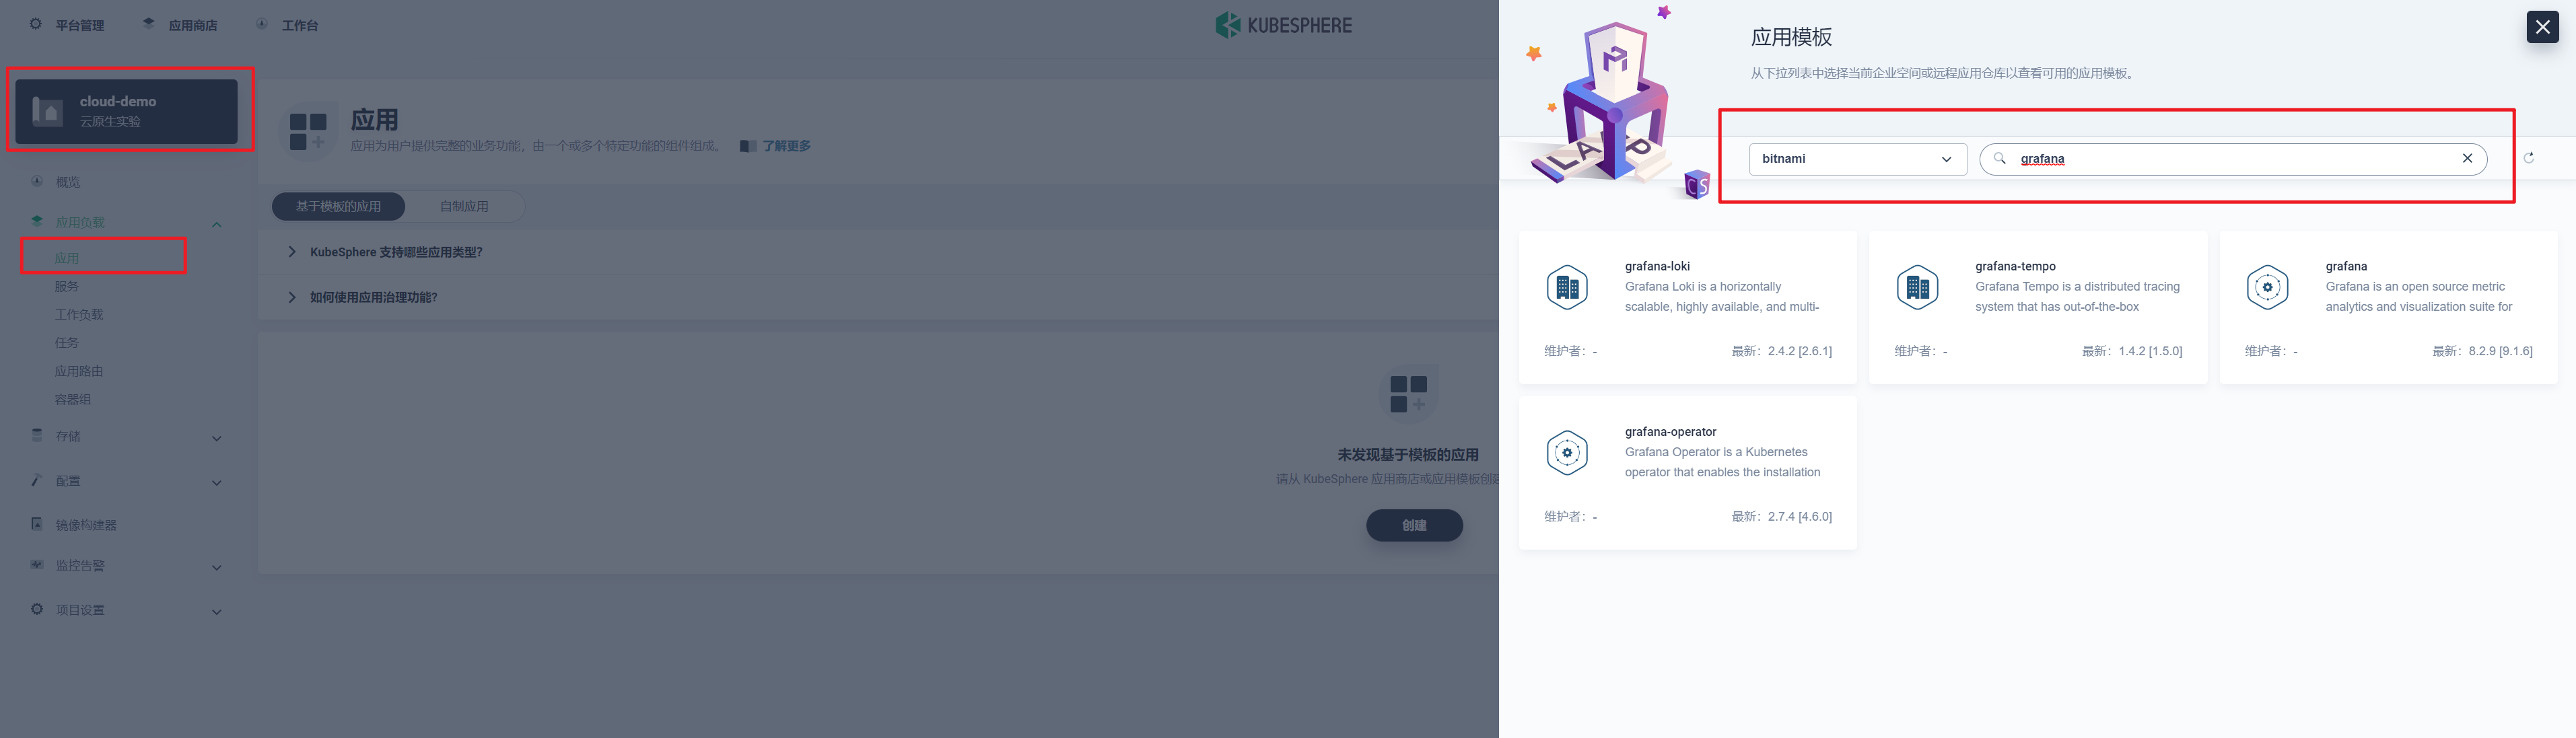
2、安装Grafana
- 我们依次打开企业空间-项目-点击要安装到的具体项目-点击应用-点击右侧的创建按钮;
- 弹出对话框中点击从应用模版,从应用仓库列表中选择我们刚刚添加的 bitnami 的仓库,搜索 Grafana 点击后安装即可。
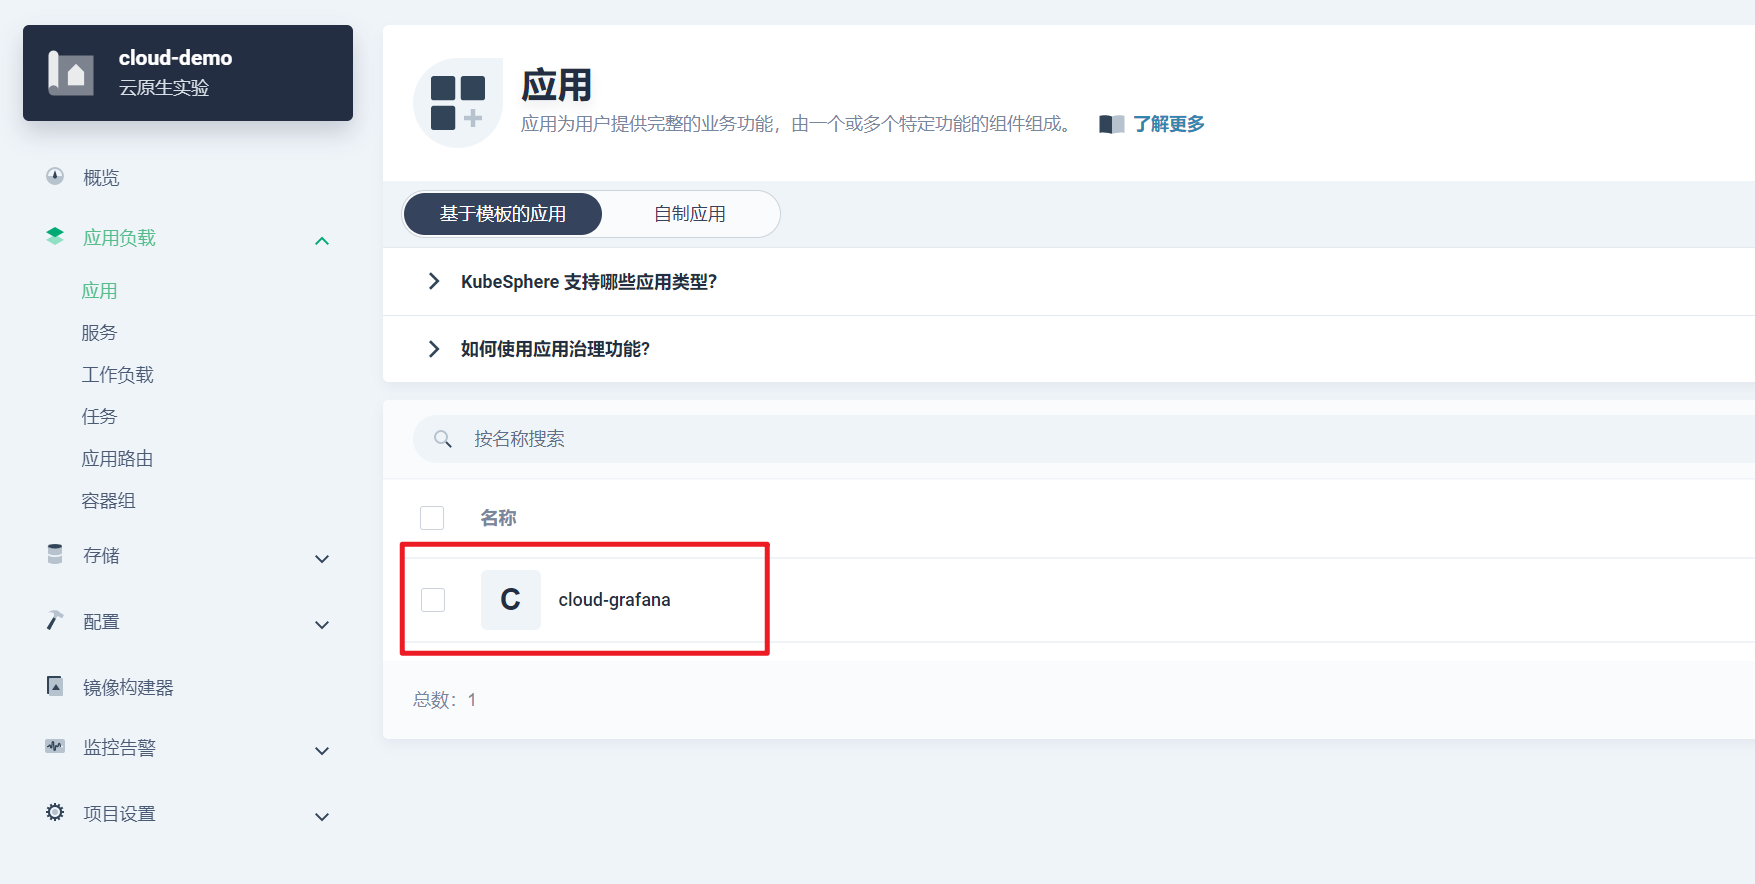
安装完成后我们在服务里给grafana的服务开启NodePort外部访问,比如我这里的的访问地址为:http://172.30.10.73:28328/
3、设置Grafana 数据源
- 我们使用管理员账号admin登录进 Grafana,默认密码可以在项目的保密字典中的 cloud-grafana-admin 中找到;
- 登录后我们点击左侧的小齿轮-datasource 在打开页面中选择 Add data source 然后选择 Prometheus 在 URL 中填入我们上面说到的 Prometheus 的 URL 地址。如图所示:
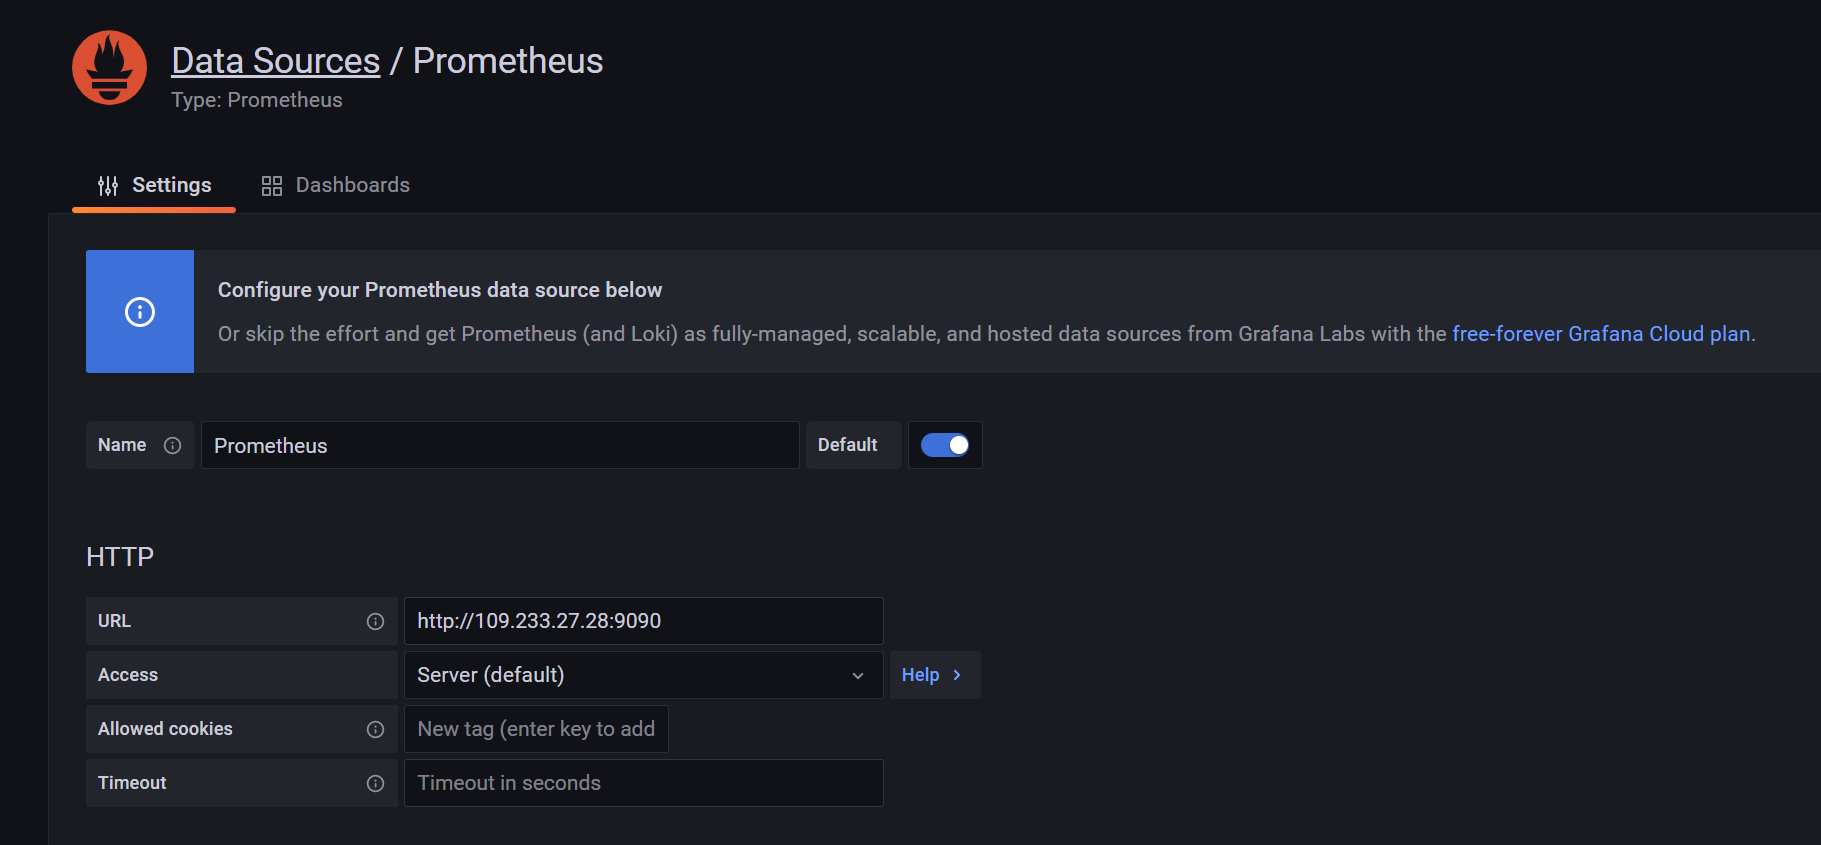 Prometheus可以通过如下方式找到kubectl get svc -n kubesphere-monitoring-system
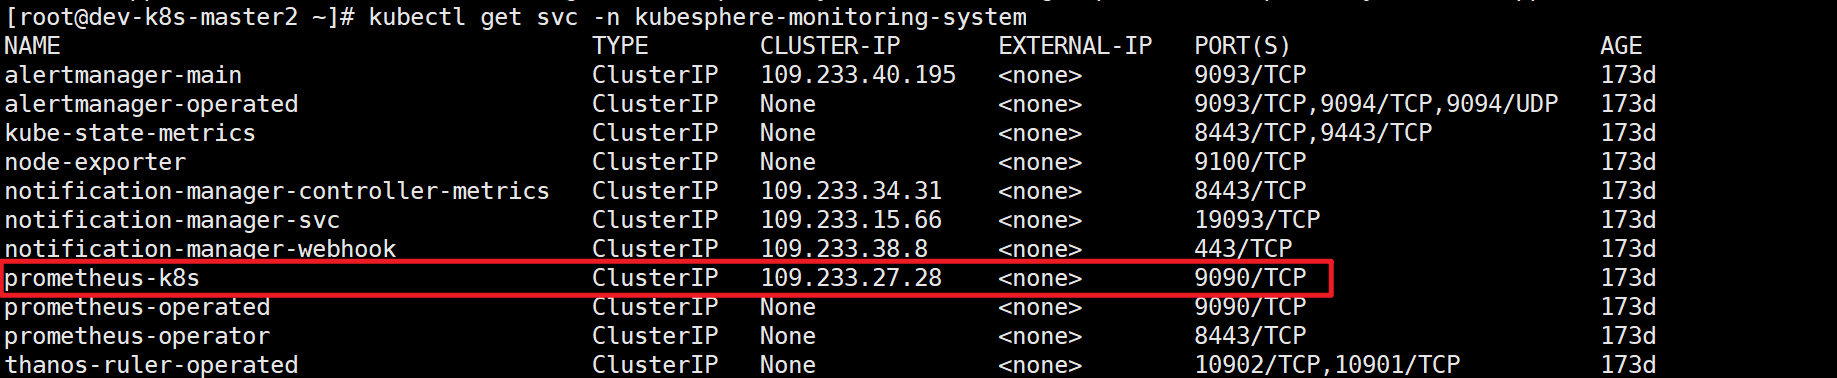 填写后拖到最下面,点击 save&test。
4、导入 Dashbord
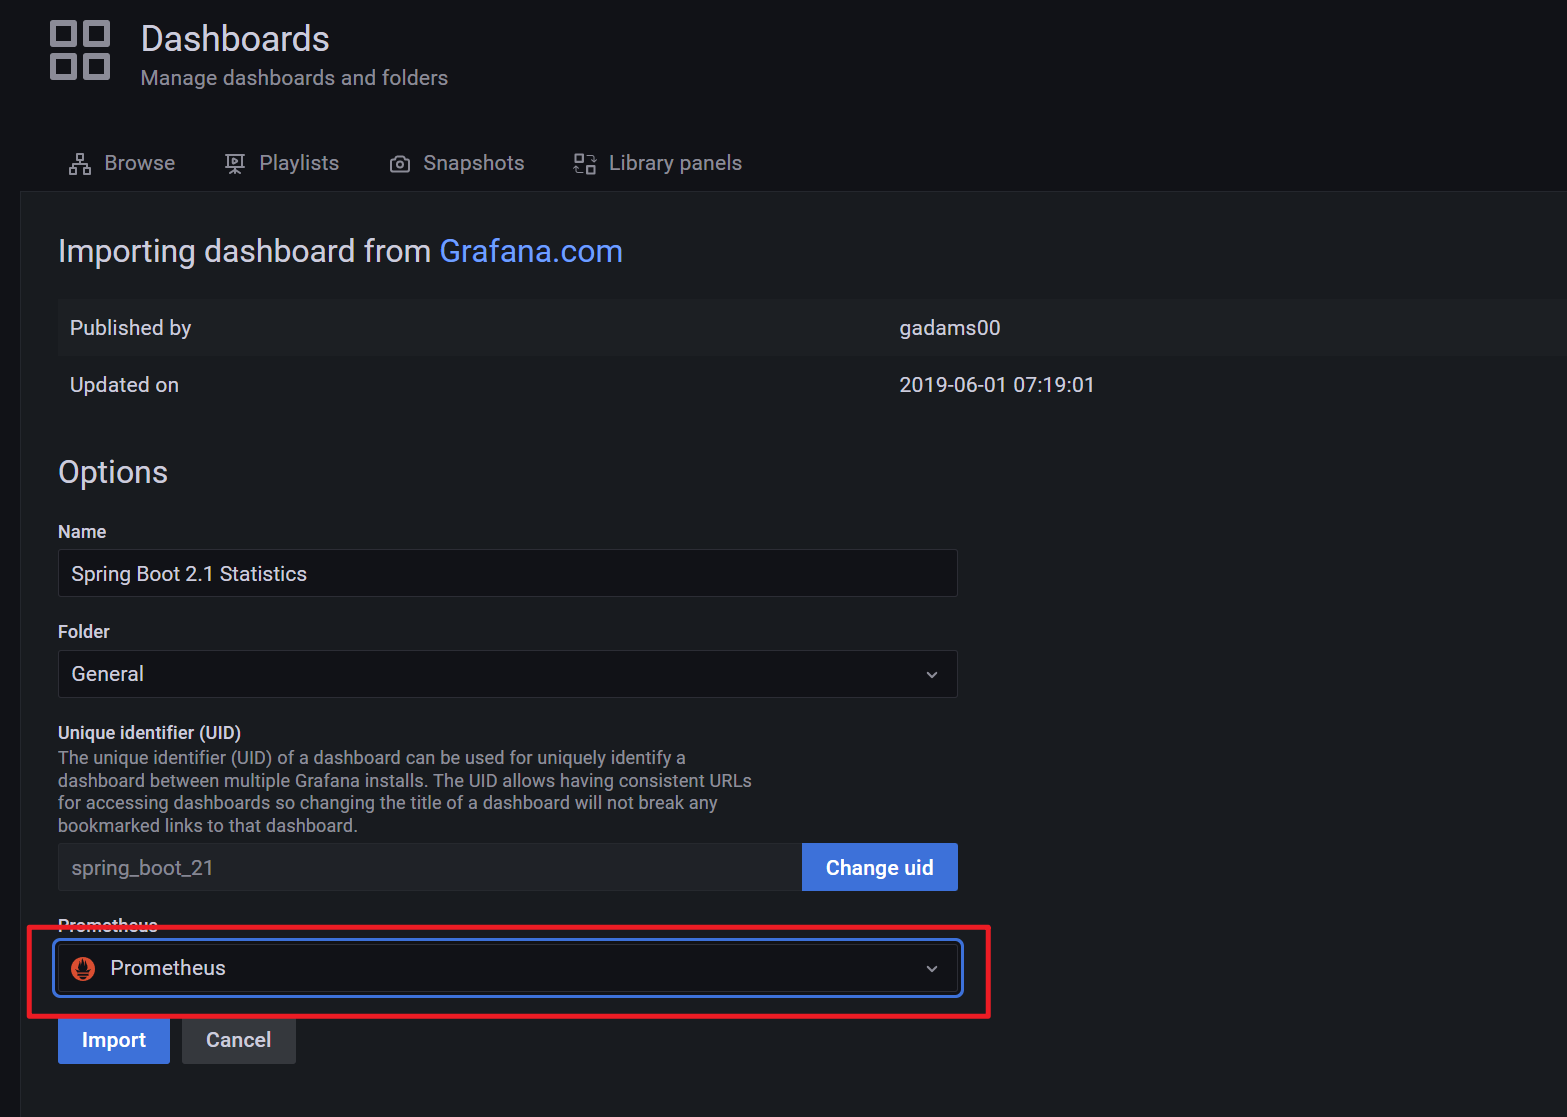
- 我们点击页面左侧➕-import;
- 输入我们从 grafana 官网 获得的对应的模版的 id 点击 load(我这里使用的是Spring Boot 2.1 Statistics | Grafana Labs);
- 在下一步中选择 Prometheus 为我们配置的数据源 点击 import 即可。
之后我们就可以看到配置的应用监控了。
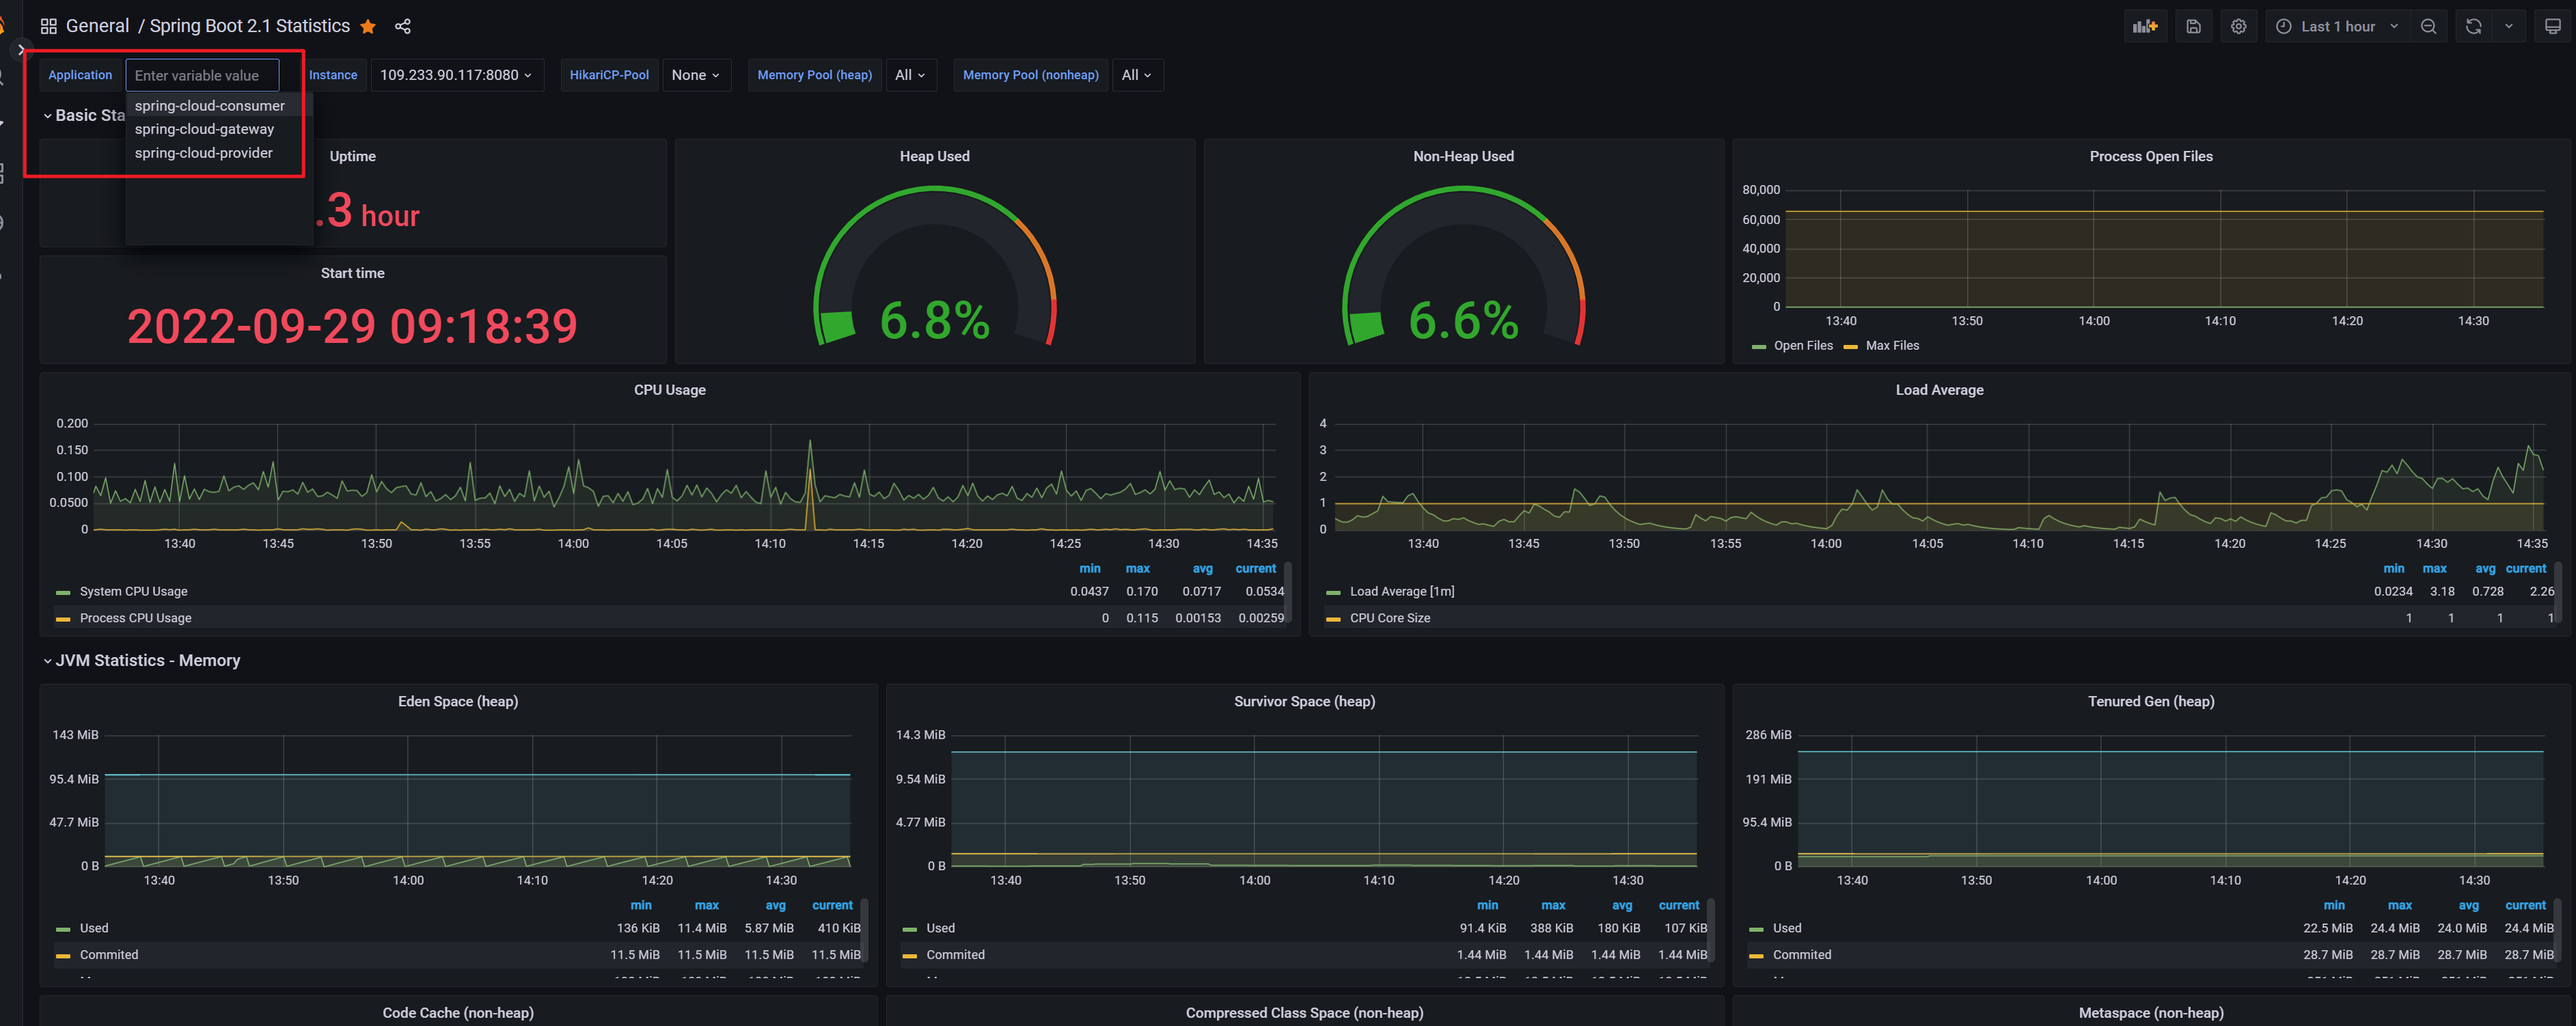
多个应用之间可以通过左上角进行切换,符合预期。
附录
- [1] grafana官网 https://grafana.com/grafana/dashboards
- [2] Spring Boot 2.1 Statistics https://grafana.com/grafana/dashboards/10280-microservices-spring-boot-2-1
- [3] ServiceMonitor https://prometheus-operator.dev/docs/operator/design/#servicemonitor
添加告警
KubeSphere 告警系统
- 使用 admin 用户登录控制台。点击左上角的平台管理,选择集群管理。
- 点击 CRD,在搜索栏中输入 clusterconfiguration。点击结果查看其详细页面。信息定制资源定义 (CRD) 允许用户在不新增 API 服务器的情况下创建一种新的资源类型,用户可以像使用其他 Kubernetes 原生对象一样使用这些定制资源。
- 在自定义资源中,点击 ks-installer 右侧的
 ,选择编辑 YAML。
 - 在该 YAML 文件中,搜寻到 alerting,将 enabled 的 false 更改为 true。完成后,点击右下角的确定,保存配置。
1 | alerting: |
- 在 kubectl 中执行以下命令检查安装过程:
1 | kubectl logs -n kubesphere-system $(kubectl get pod -n kubesphere-system -l app=ks-install -o jsonpath='{.items[0].metadata.name}') -f |
备注您可以通过点击控制台右下角的  找到 kubectl 工具。
配置告警通道
安装完报警系统后打开平台的平台管理
选择平台设置
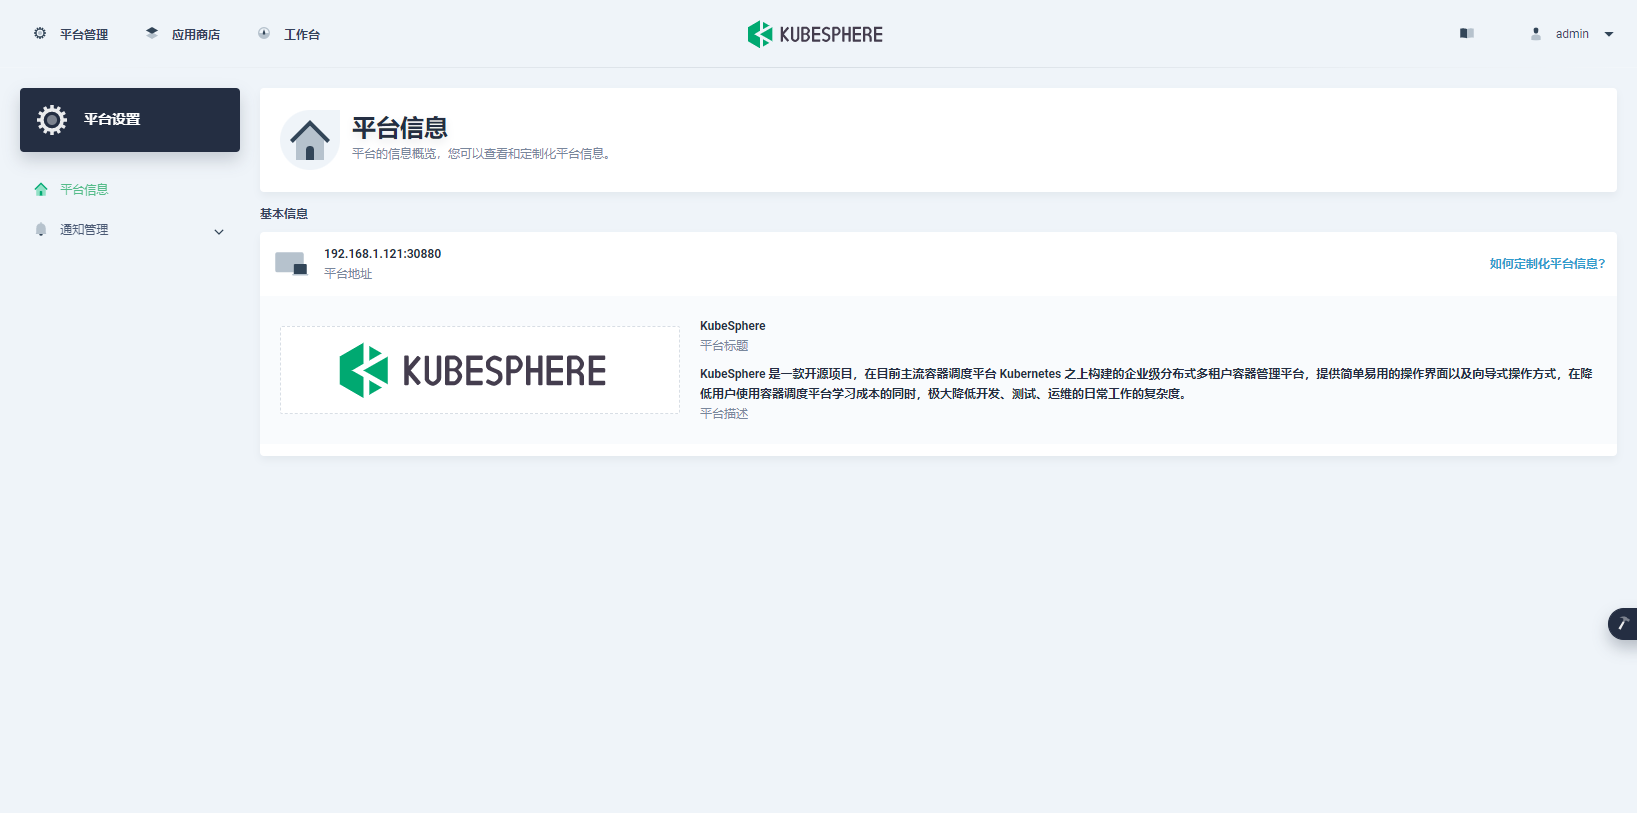
选择通知管理——通知配置
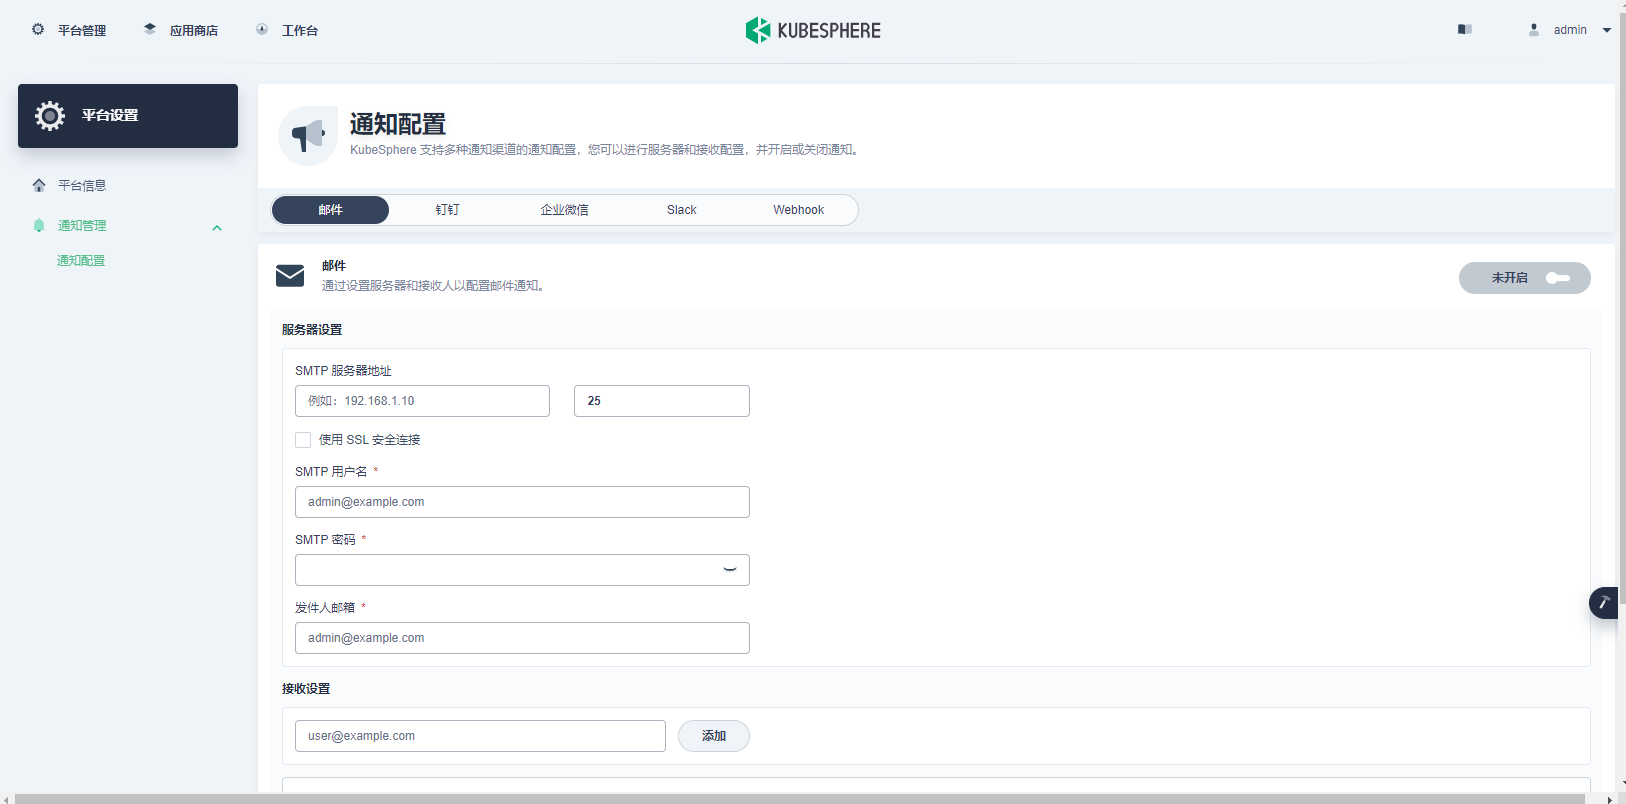
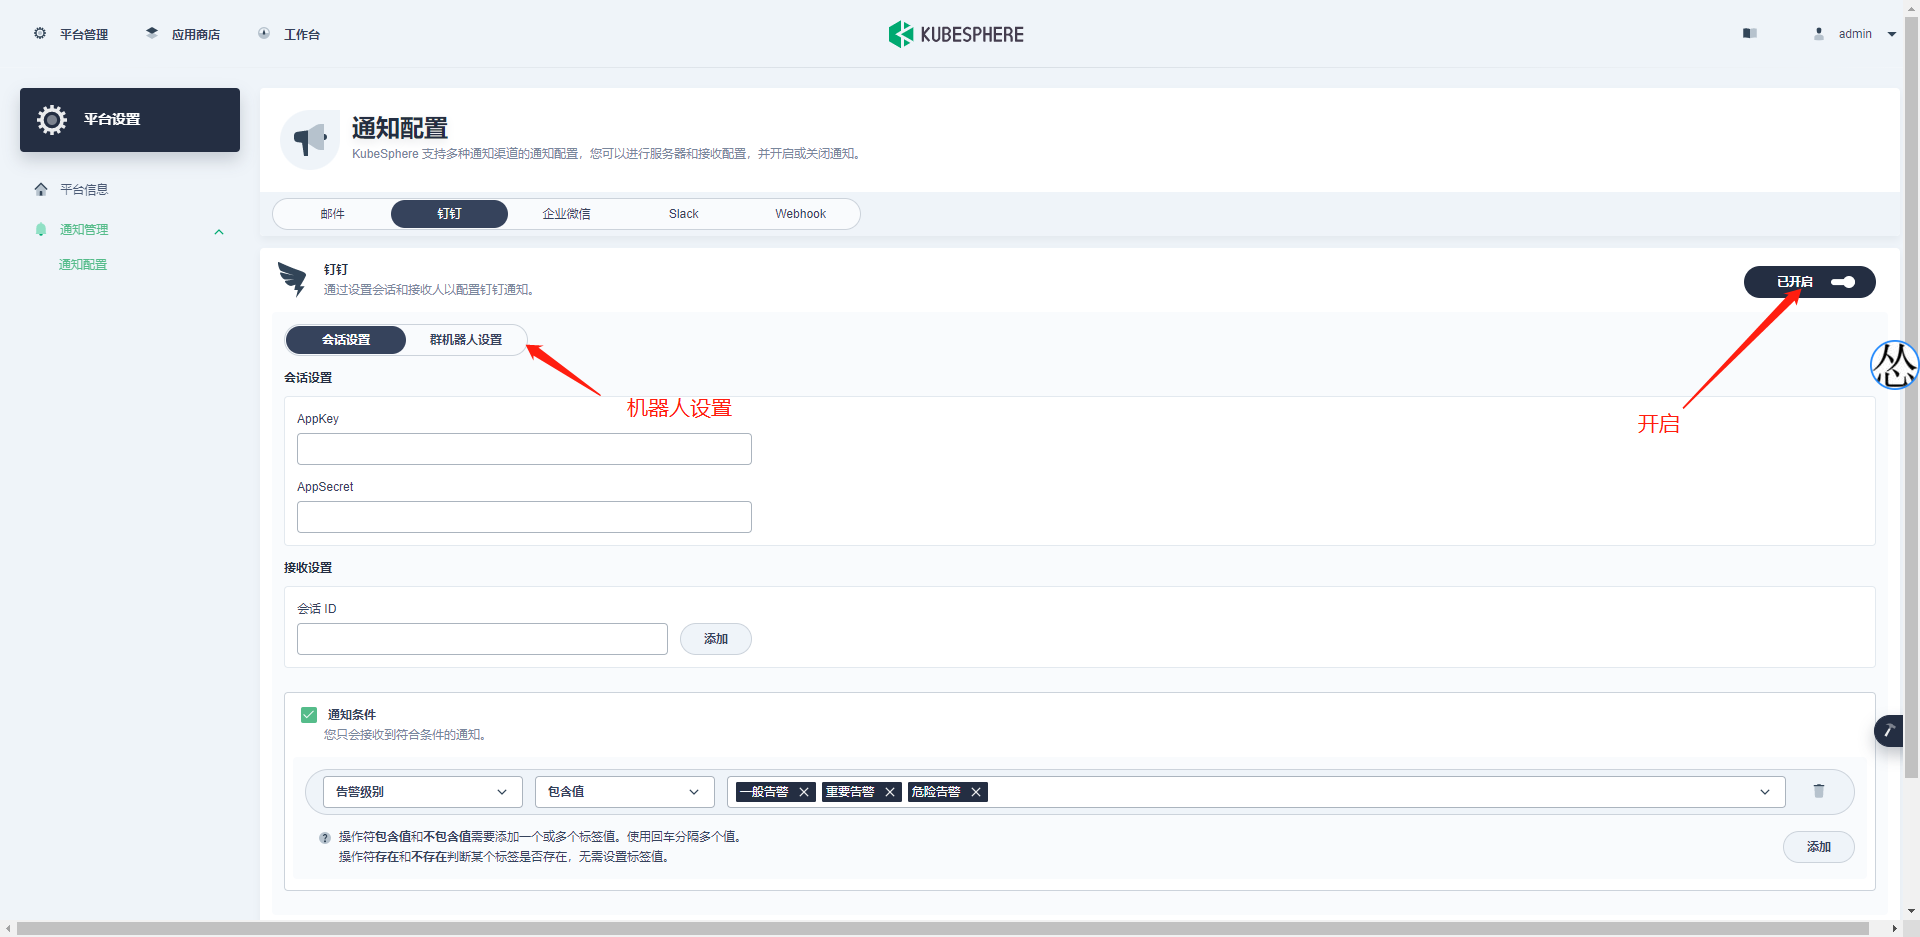
我们这里以钉钉机器人为例:
打开钉钉界面
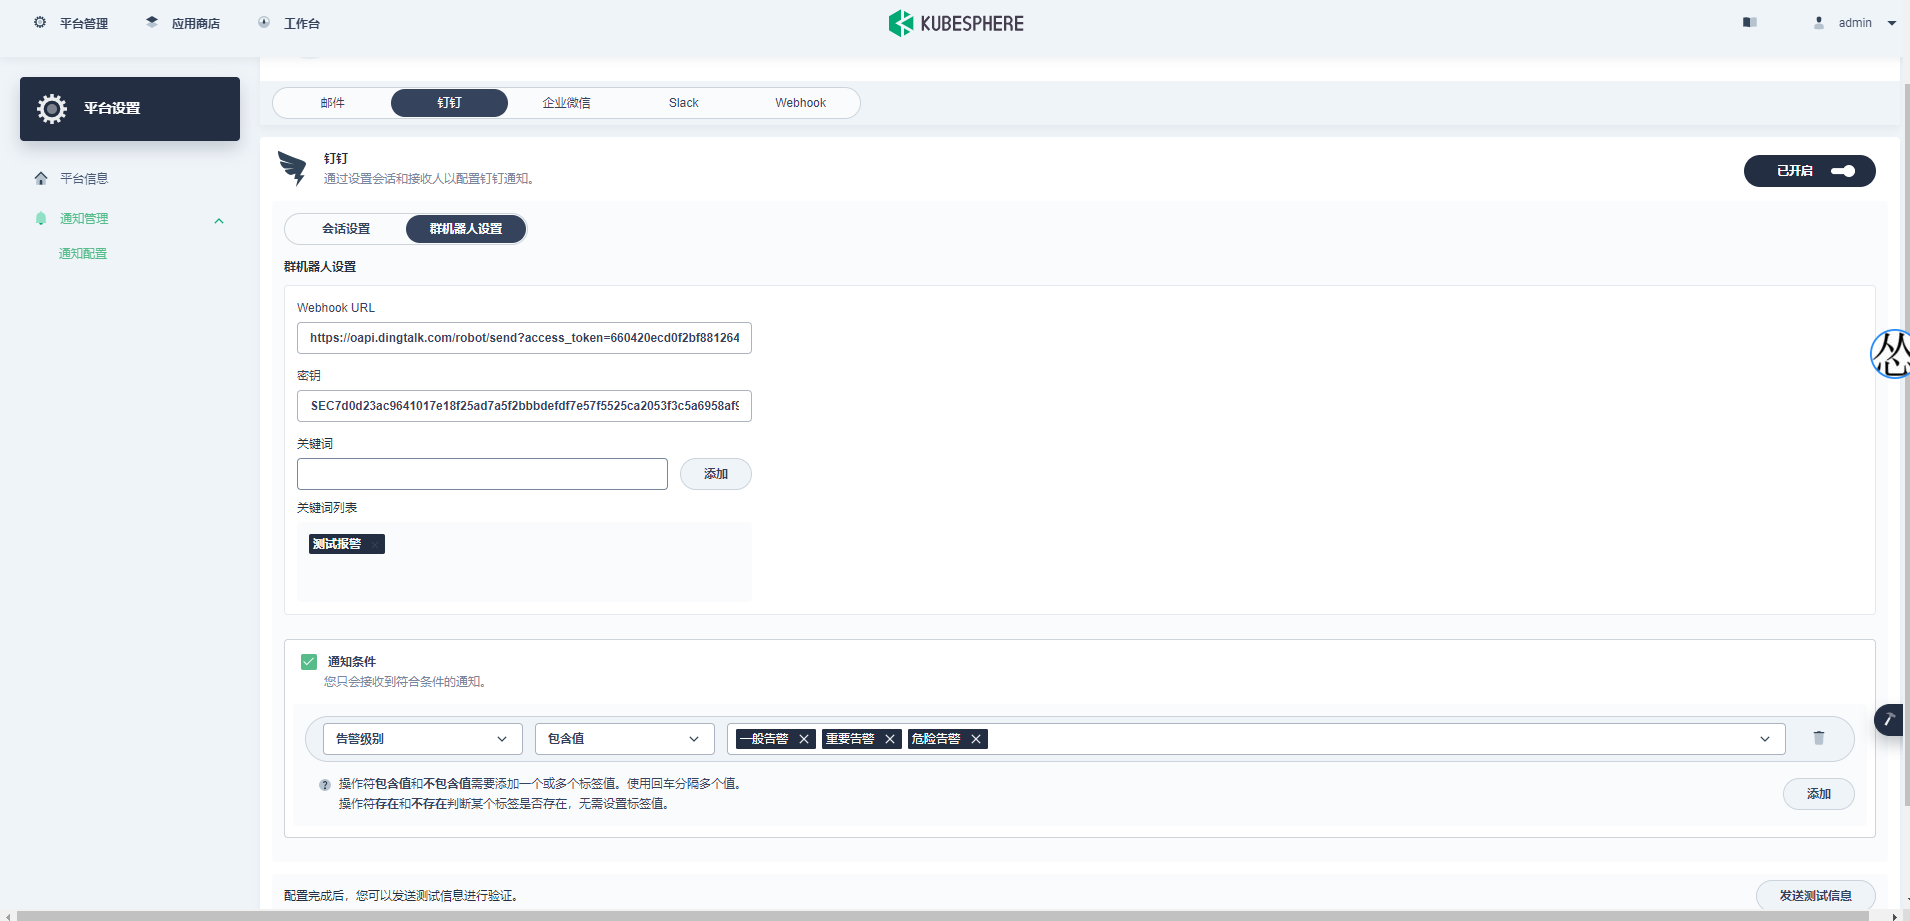
然后点击发送测试消息
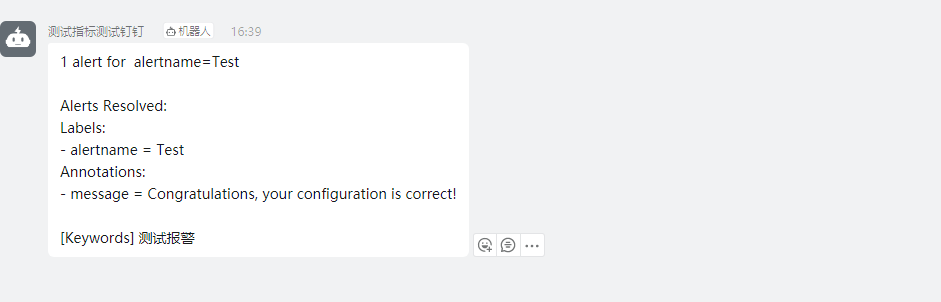
收到证明正常
配置告警策略
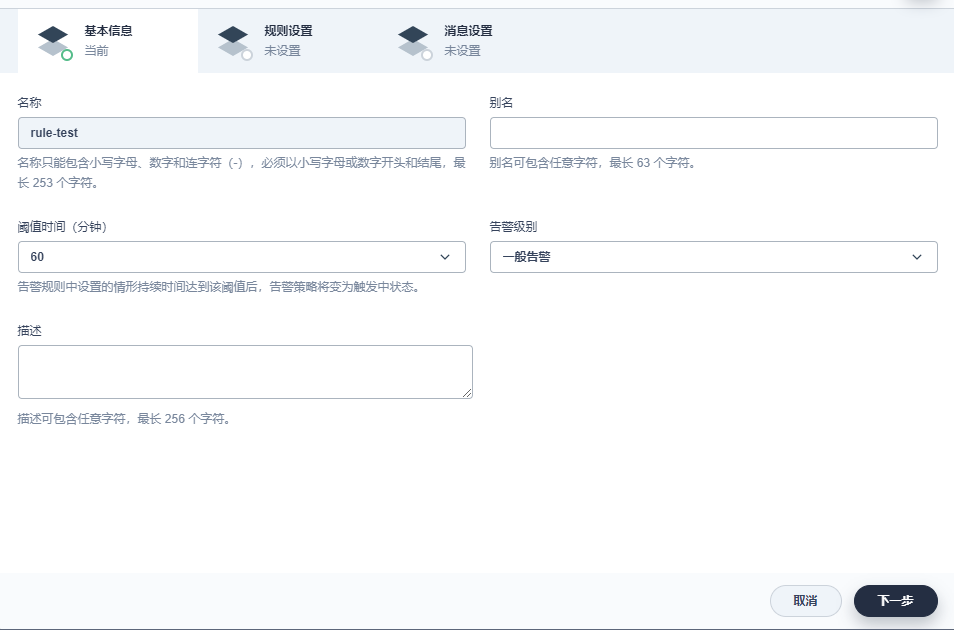
打开项目选择告警策略
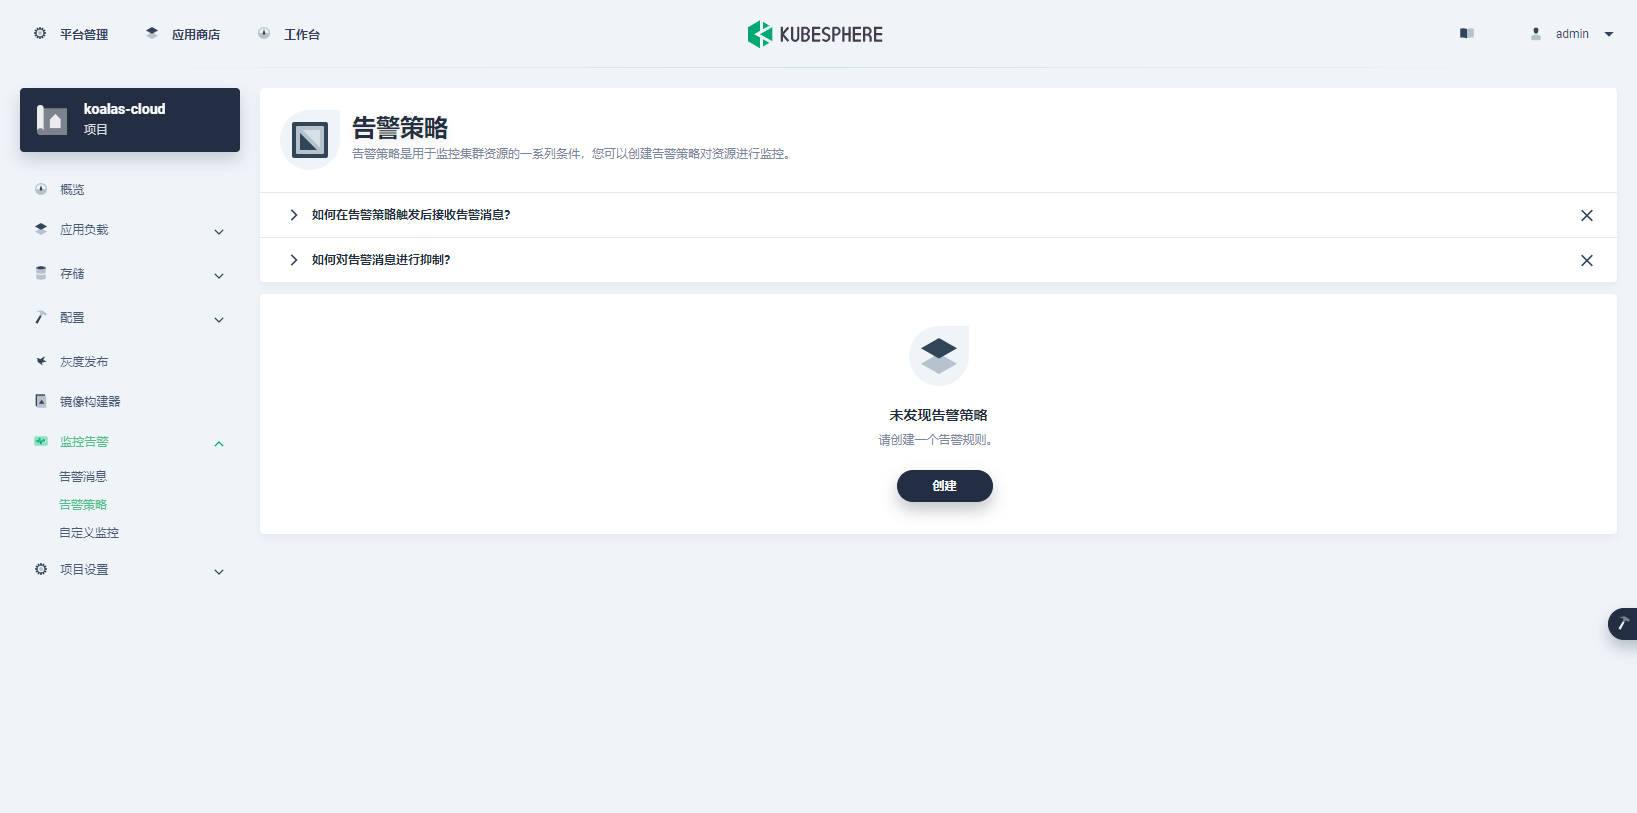
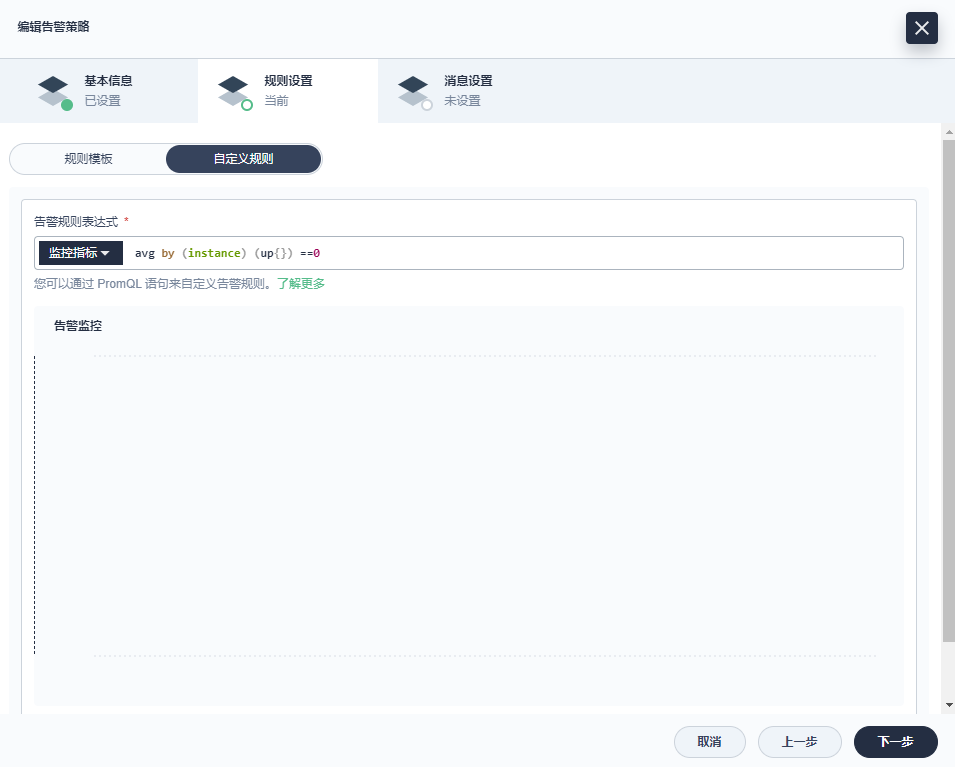
点击创建
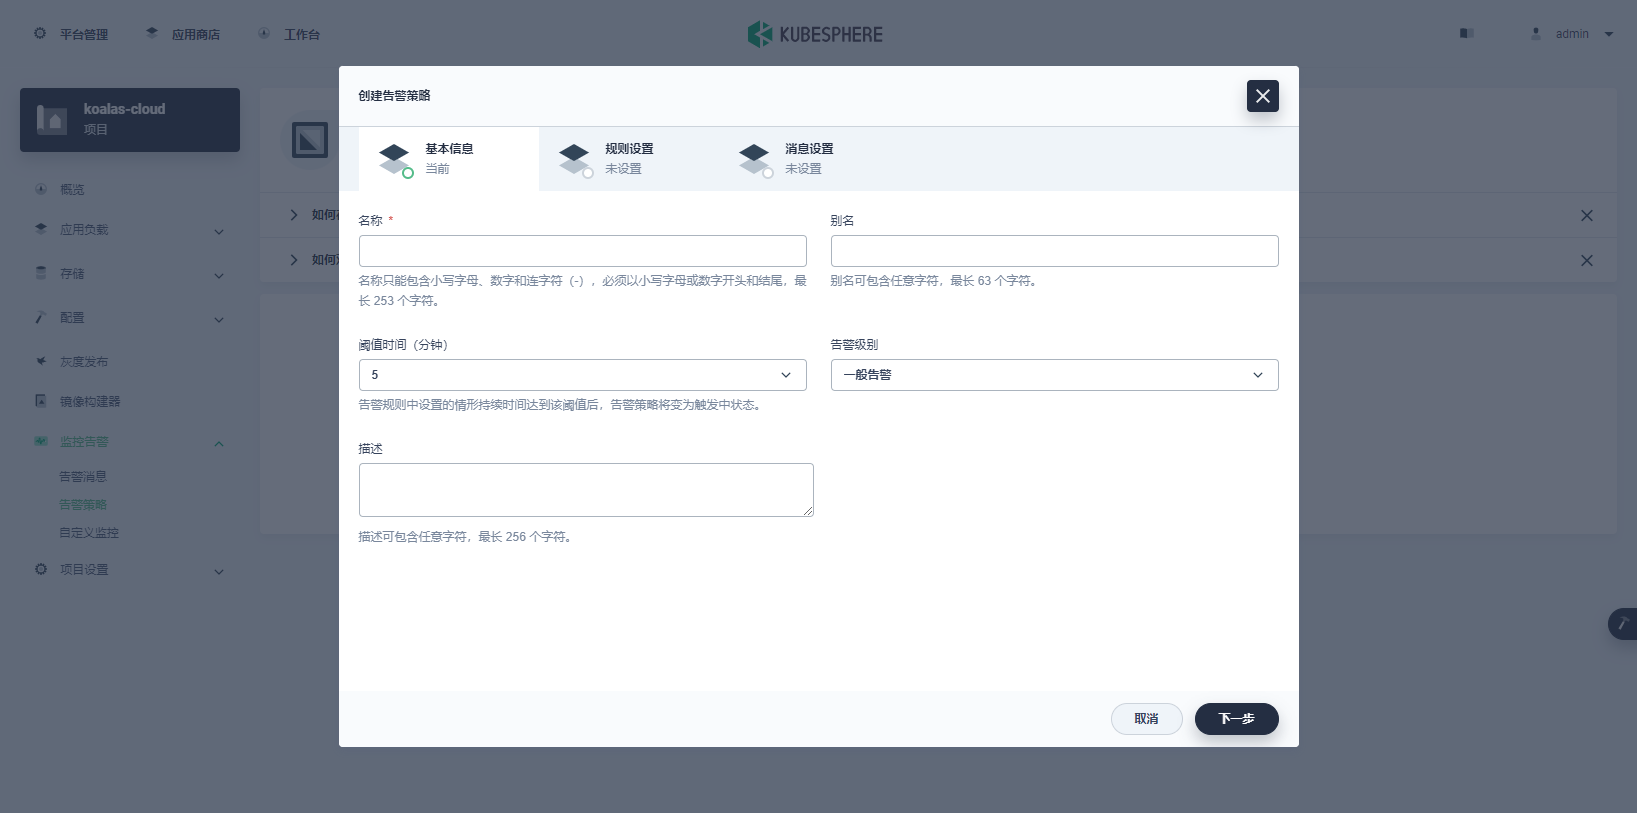
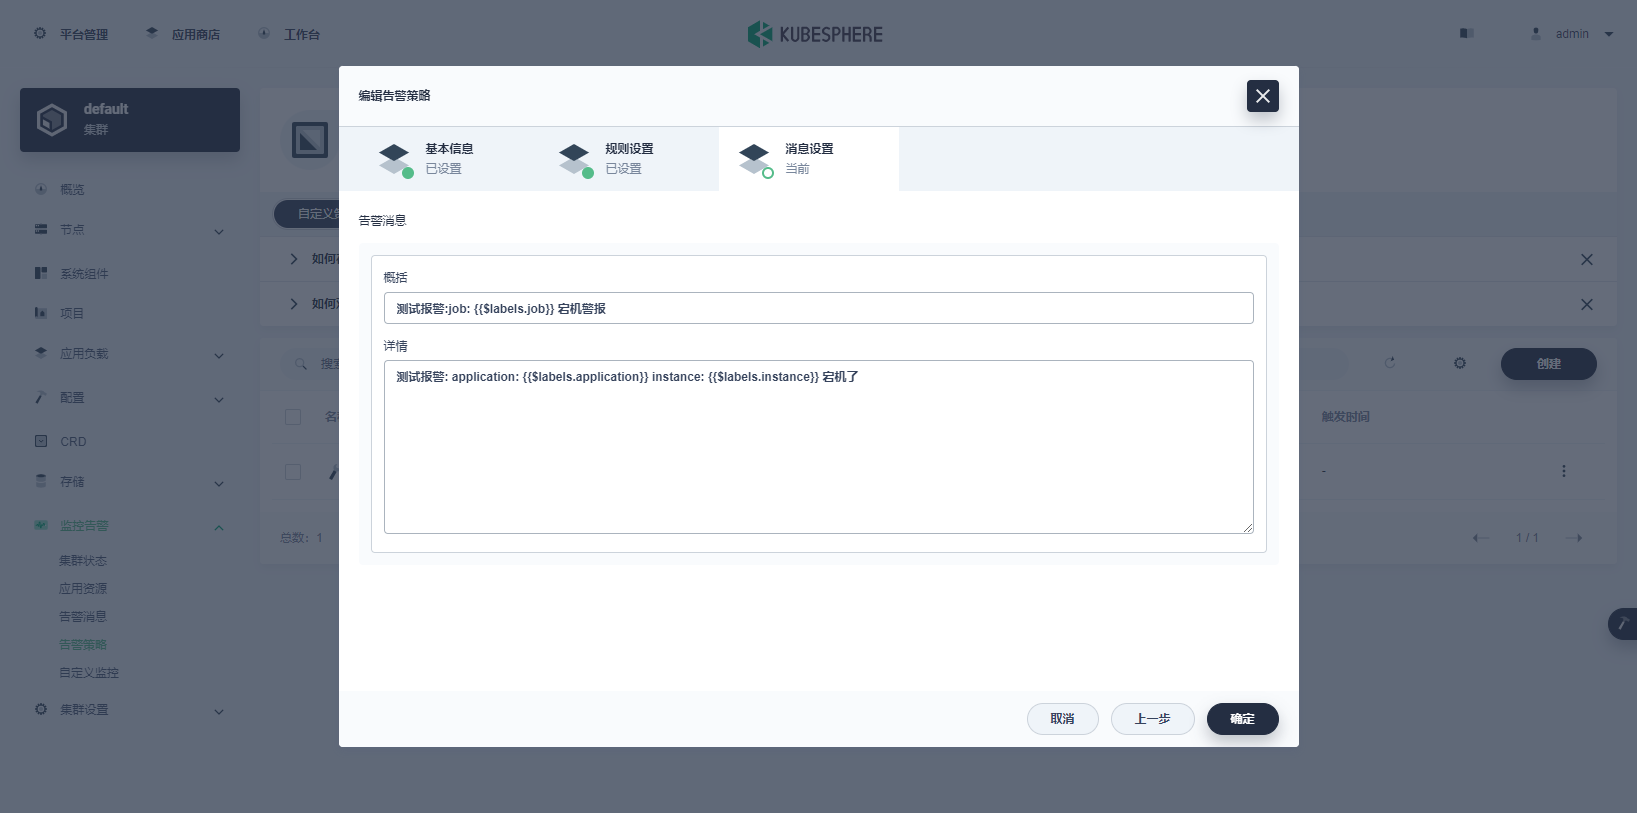
备注:消息内容中必须包含钉钉中设置的报警关键词
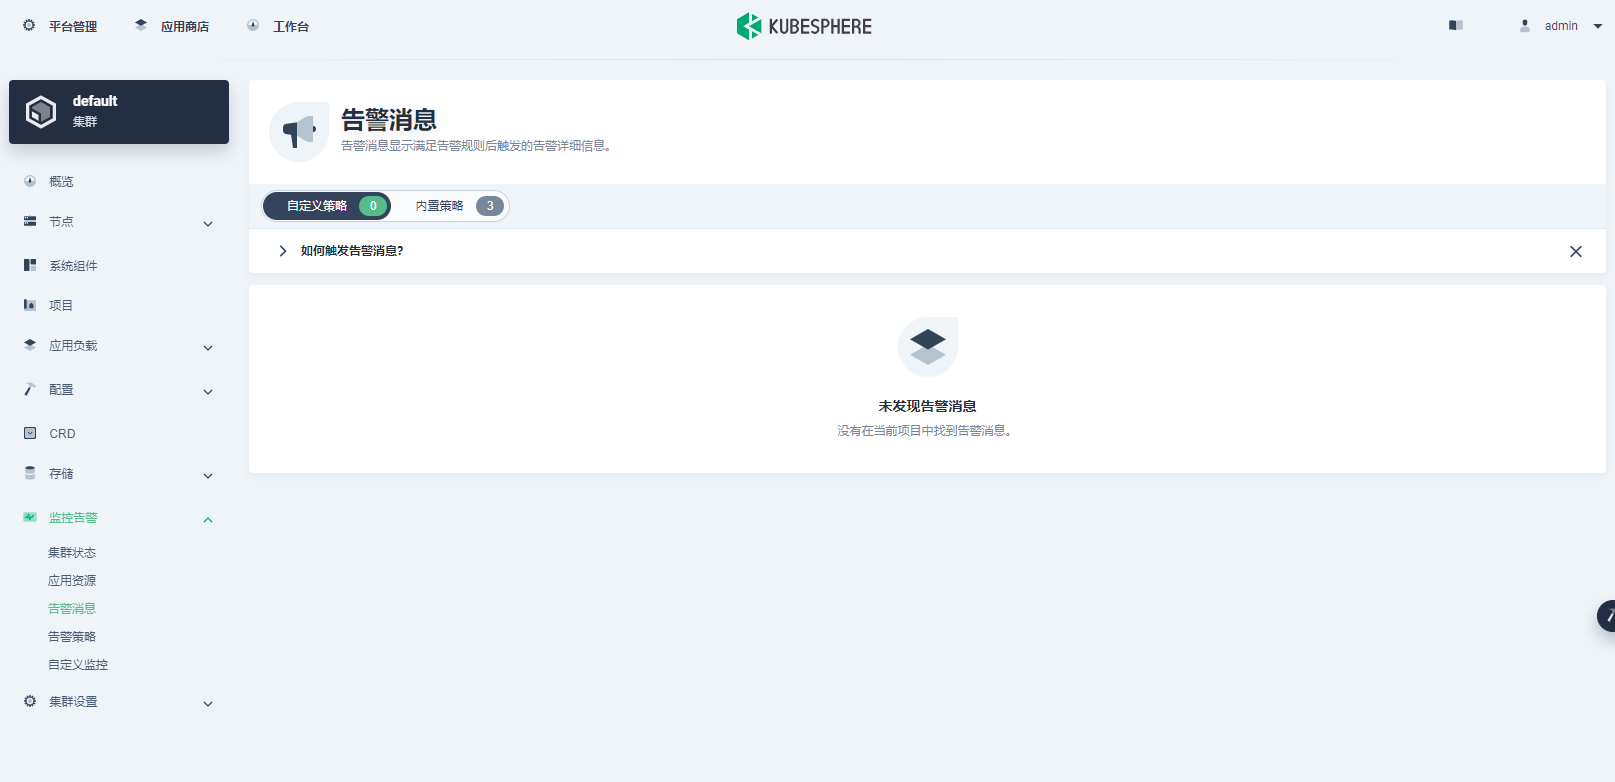
告警消息
打开监控告警——告警消息可以看到告警列表